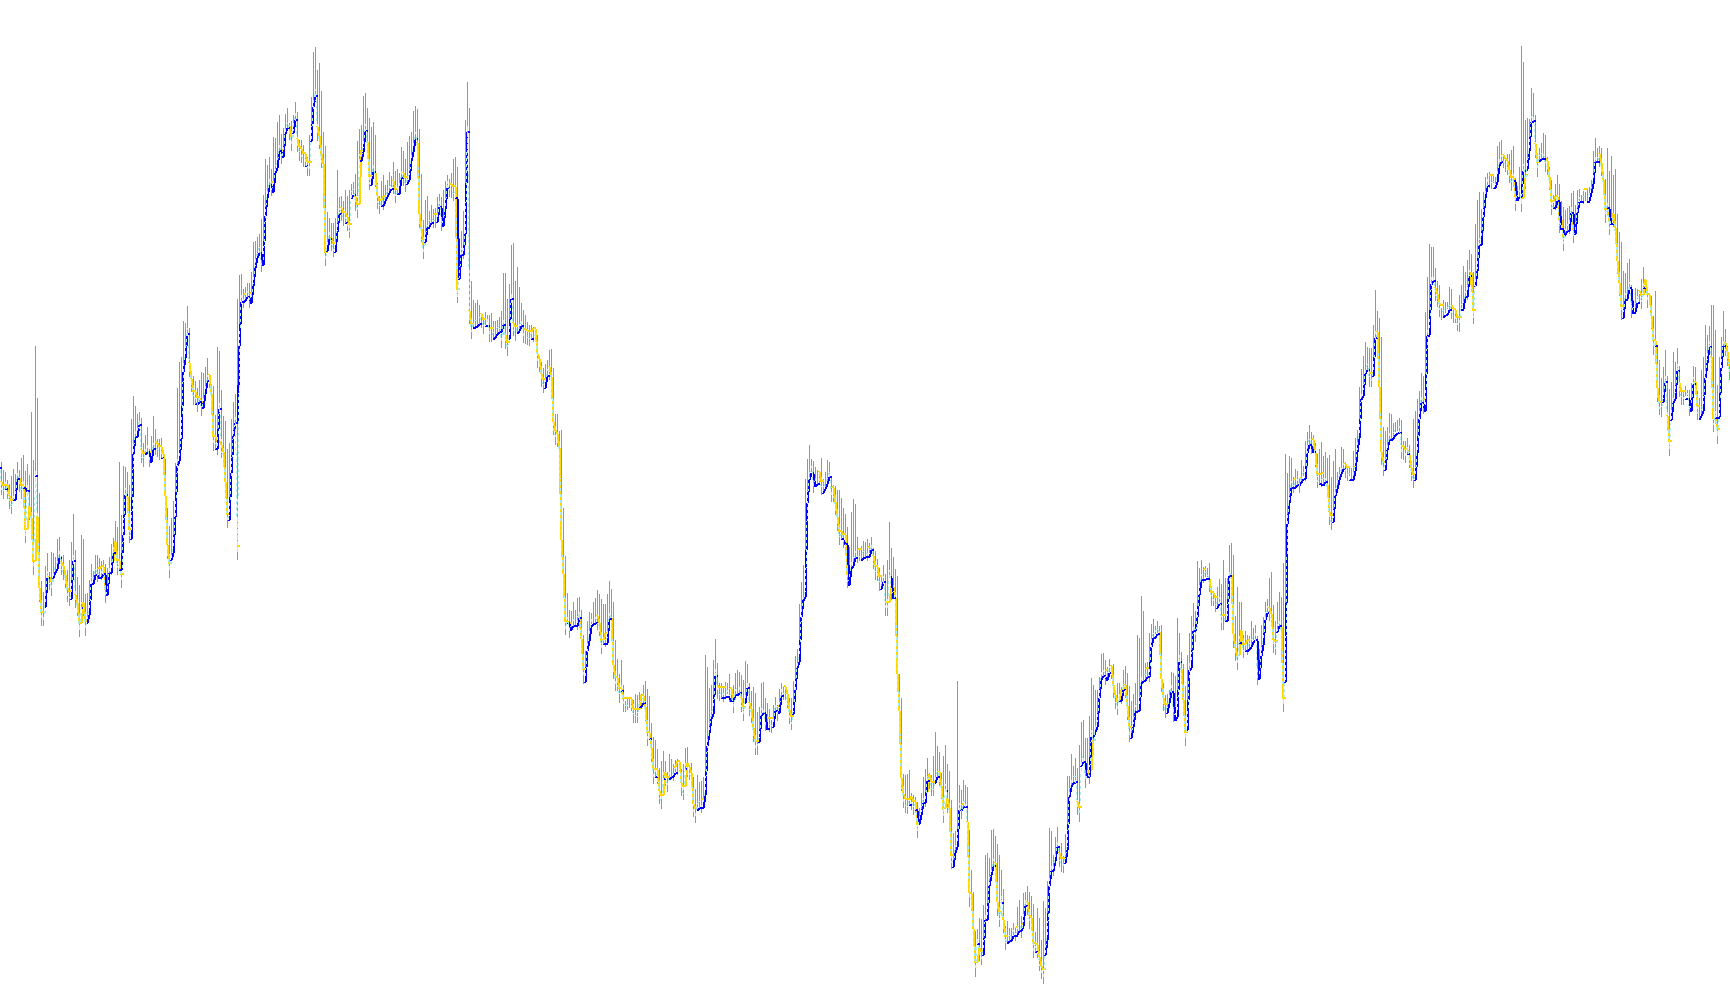
This tool is a trend-based technical indicator designed for the MetaTrader 4 platform to help traders visualize market structure, identify potential reversal points, and establish logical price boundaries for risk management. It operates by analyzing price action across various timeframes (from 1 minute to 1 hour) and provides clear visual cues on the chart.
Core Logic and Functionality
The indicator works by calculating a dynamic "Price Range." Instead of looking at static price points, it evaluates the relationship between historical highs and lows over a specific period. Here is how the underlying logic processes market data:
- Dynamic Boundary Tracking: The script continuously scans past price bars to identify significant high and low points. Based on a user-defined "Range" parameter (which should be adjusted according to the specific currency pair, such as EURUSD or GBPUSD), it creates a corridor of price movement.
- Trend Identification: The logic determines the current market direction by monitoring whether price action is pushing toward the upper boundary or breaking through the lower boundary. It distinguishes between three primary states:
- An upward trend (Bullish).
- A downward trend (Bearish).
- A neutral state where the price is consolidating within the established range.
- Reversal Detection: The script is specifically designed to identify "Stop and Reverse" moments. It monitors for instances where the price moves aggressively enough to shift the dominant direction of the corridor, signaling a potential trend change or an exhaustion point.
Visual Components on Your Chart
When you apply this indicator, it provides three distinct visual elements:
- Upper Boundary (Violet Line): This represents the ceiling of the current price movement. When the market is in a bearish state, this line highlights the key level where sellers are active.
- Lower Boundary (SkyBlue Line): This represents the floor of the current price movement. In a bullish state, this line highlights where buyers are stepping in.
- Median (Silver Dotted Line): This serves as the equilibrium point between the high and low boundaries, helping you see the "fair value" of the current range.
Practical Application for Traders
The primary purpose of this tool is to assist in making informed decisions regarding entry and exit points:
- Stop-Loss Placement: By identifying the established range boundaries, traders can use these levels to set logical stop-loss orders that are outside of the "noise" of normal market fluctuations.
- Trend Reversal Alerts: The indicator provides on-screen text comments (e.g., "BUY" or "SELL") when a reversal is detected. These alerts occur when the price action shifts from one boundary to another, indicating that the previous trend may have ended and a new direction is forming.
- Customization: Because different currency pairs have different volatilities, the script allows you to adjust the "Range" value to ensure the boundaries align perfectly with the specific instrument you are trading.
// Range stop & reverse.mq4
// Èíäèêàòîð "Äèàïàçîí ñòîï è ðàçâîðîò"
//Èíäèêàòîð òðåíäîâûé. Ïåðèîä îò Ì1 äî Í1. Äëÿ EURUSD ëó÷øåå çíà÷åíèå Range=35,
//äëÿ GBPUSD ëó÷øåå çíà÷åíèå Range=65. Ñâÿçàíî ñ îïòèìàëüíûì óðîâíåì ñòîïà äëÿ
//ñèìâîëà (èíñòðóìåíòà). Ìîæíî èñïîëüçîâàòü äëÿ óñòàíîâêè ñòîï ëîññ è äëÿ îòêðûòèÿ ïîçèöèé.
#property copyright "mandorr@gmail.com"
#property indicator_chart_window
#property indicator_buffers 3
#property indicator_color1 Violet
#property indicator_color2 SkyBlue
#property indicator_color3 Silver

extern int Range=35;          // Äèàïàçîí â ïèïñàõ
extern int CountBars=10000;   // Êîëè÷åñòâî îòîáðàæàåìûõ áàðîâ

double buffer0[];
double buffer1[];
double buffer2[];

void init() {
   SetIndexStyle(0,DRAW_LINE,STYLE_SOLID,2);
   SetIndexBuffer(0,buffer0);
   SetIndexLabel(0,"Âåðõíÿÿ ãðàíèöà");
   SetIndexDrawBegin(0,0);

   SetIndexStyle(1,DRAW_LINE,STYLE_SOLID,2);
   SetIndexBuffer(1,buffer1);
   SetIndexLabel(1,"Íèæíÿÿ ãðàíèöà");
   SetIndexDrawBegin(1,0);

   SetIndexStyle(2,DRAW_LINE,STYLE_DOT,1);
   SetIndexBuffer(2,buffer2);
   SetIndexLabel(2,"Ìåäèàíà");
   SetIndexDrawBegin(2,0);

   IndicatorShortName("Äèàïàçîí ñòîï è ðàçâîðîò ("+Range+" ïèïñîâ)");
}

void deinit() {
   Comment("");
}

void start() {
   int dir, dir1, i;
   double h, l, h1, l1;
   h=(High[CountBars]+Low[CountBars]+Range*Point)/2;
   l=(High[CountBars]+Low[CountBars]-Range*Point)/2;
   dir=0;
   for (i=CountBars-1; i>=0; i--) {
      h1=h;
      l1=l;
      dir1=dir;
      if (High[i]>h) {h=High[i]; l=h-Range*Point;}
      if (Low [i]<l) {l=Low [i]; h=l+Range*Point;}
      if (h>h1) dir =1;
      if (l<l1) dir=-1;
      if (h>h1 && l<l1) dir=0;
      buffer0[i]=EMPTY_VALUE;
      buffer1[i]=EMPTY_VALUE;
      if (dir<0) buffer0[i]=h;
      if (dir>0) buffer1[i]=l;
      if (dir1<0 && dir>0) buffer0[i]=h1;
      if (dir1>0 && dir<0) buffer1[i]=l1;
      buffer2[i]=(h+l)/2;
   }
   if (buffer0[0]!=EMPTY_VALUE) Comment("SELL, ñòîï è ðàçâîðîò  "+DoubleToStr(buffer0[0],Digits));
   if (buffer1[0]!=EMPTY_VALUE) Comment("BUY, ñòîï è ðàçâîðîò  "+DoubleToStr(buffer1[0],Digits));
}
Comments