Velocity_v2
Download script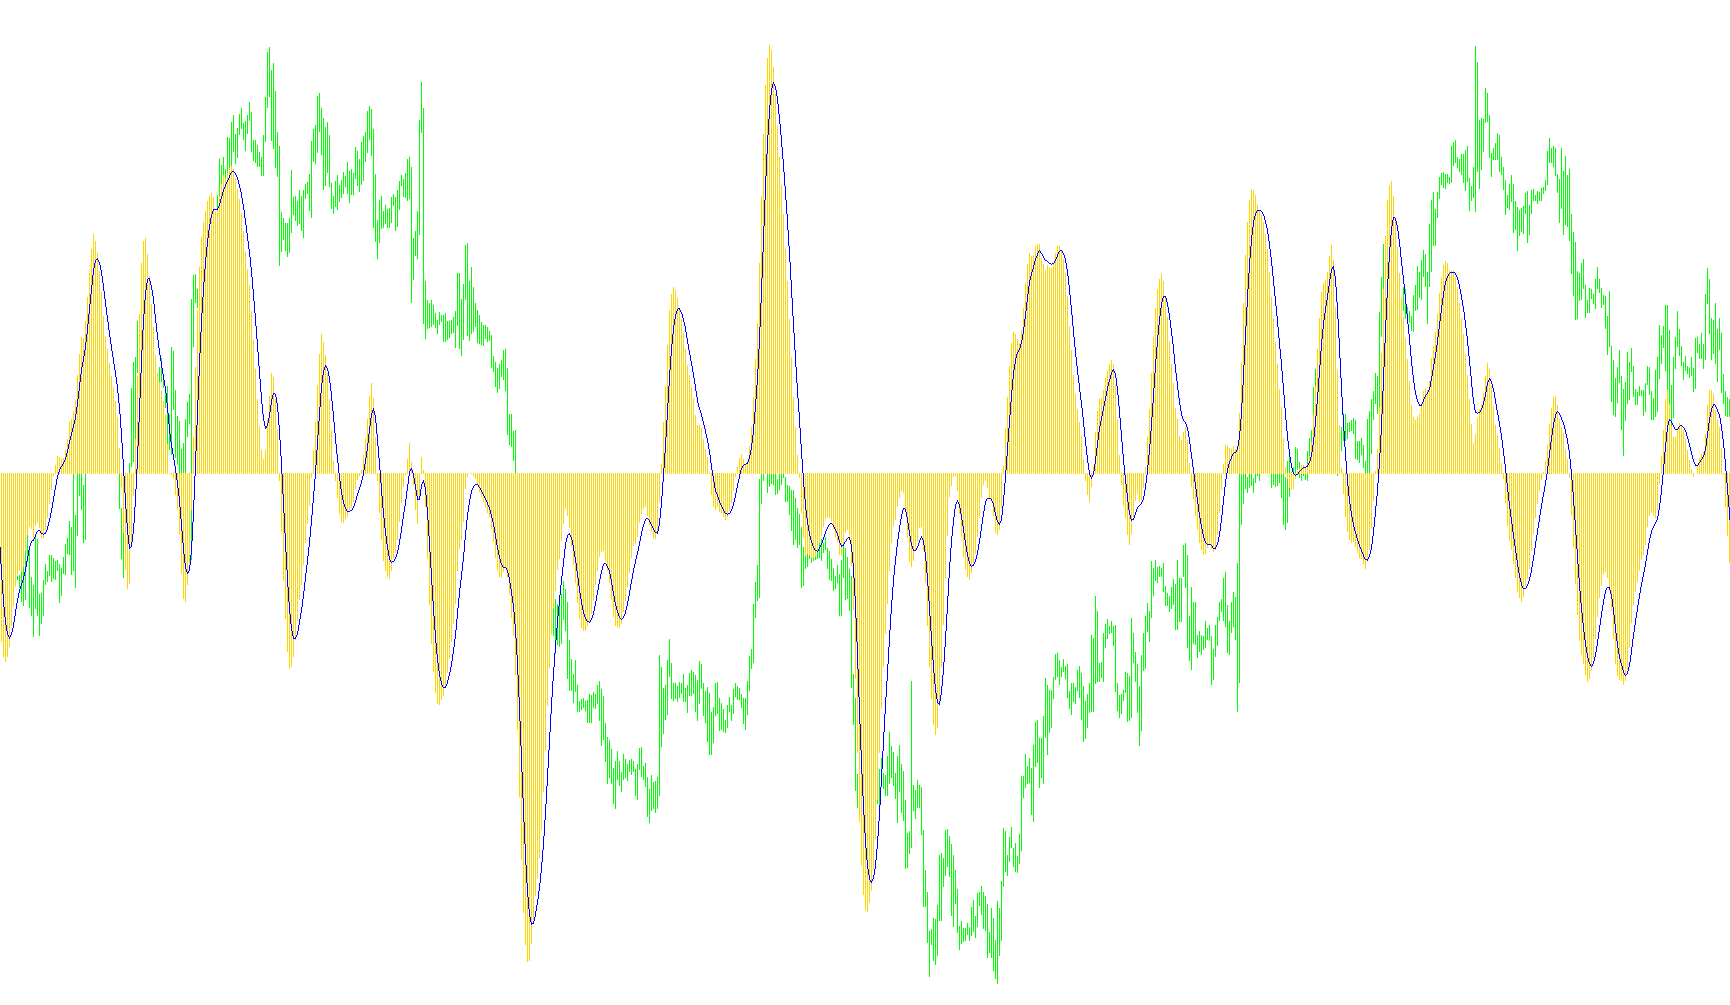
The Velocity v2 indicator is designed to provide traders with a visual representation of market momentum by measuring the rate of change in price over time. Rather than looking at the raw price of an asset, this tool analyzes how quickly that price is moving, filtering out minor fluctuations to reveal the underlying "velocity" of the trend.
Core Methodology
The logic follows a multi-layered smoothing process. It begins by calculating the immediate price movement between consecutive candles. By taking the difference between the current closing price and the previous one, the script establishes a base measurement of speed.
From this base measurement, the indicator applies several successive layers of moving averages. Each layer serves a specific purpose in refining the data:
- Velocity Tracking: The initial calculation identifies the raw speed of price changes.
- Average Velocity: By applying a primary smoothing filter (based on a user-defined period), the tool removes "noise" and erratic spikes, creating a cleaner representation of the trend's speed.
- Double Average Velocity: The script performs a second round of smoothing on the first average. This further stabilizes the data, making it easier to identify sustained trends versus temporary volatility.
- Fast and Slow Components: Finally, the logic derives two distinct lines—a "Fast" component and a "Slow" component. These are generated by applying additional moving averages to the double-smoothed velocity.
Visual Output and Interpretation
The indicator is displayed in a separate window below the main price chart, featuring two primary visual elements:
- Histogram: Represents the initial fast-moving data, providing a clear view of the immediate momentum.
- Line Plot: Represents the slower, more stabilized trend component.
By comparing these two elements, traders can observe the relationship between short-term momentum and long-term trends. When the movements are synchronized, it often indicates a strong, healthy trend. Divergences between the fast and slow components can signal potential changes in market strength or the beginning of a trend reversal.
//+------------------------------------------------------------------+
//|                                                  Velocity_v2.mq4 |
//|                                Copyright © 2006, TrendLaboratory |
//|            http://finance.groups.yahoo.com/group/TrendLaboratory |
//|                                   E-mail: igorad2003@yahoo.co.uk |
//+------------------------------------------------------------------+
#property copyright "Copyright © 2006, TrendLaboratory"
#property link      "http://finance.groups.yahoo.com/group/TrendLaboratory"

#property indicator_separate_window
#property indicator_buffers 2
#property indicator_color1 LightBlue
#property indicator_color2 Tomato
#property indicator_width1 2
#property indicator_width2 1
#property indicator_style2 2
//---- input parameters
extern int VelocityPeriod  =8;
extern int Slow            =5;
extern int MA_Mode         =1;
//---- indicator buffers
double FastBuffer[];
double SlowBuffer[];
double Vel[];
double AvgVel[];
double DbAvgVel[];
//+------------------------------------------------------------------+
//| Custom indicator initialization function                         |
//+------------------------------------------------------------------+
  int init()
  {
   string short_name;
//---- indicator line
   IndicatorBuffers(5);
   SetIndexStyle(0,DRAW_HISTOGRAM);
   SetIndexStyle(1,DRAW_LINE);
   SetIndexBuffer(0,FastBuffer);
   SetIndexBuffer(1,SlowBuffer);
   SetIndexBuffer(2,Vel);
   SetIndexBuffer(3,AvgVel);
   SetIndexBuffer(4,DbAvgVel);

   IndicatorDigits(MarketInfo(Symbol(),MODE_DIGITS));
//---- name for DataWindow and indicator subwindow label
   short_name="Velocity("+VelocityPeriod+")";
   IndicatorShortName(short_name);
   SetIndexLabel(0,"Fast");
   SetIndexLabel(1,"Slow");
//----
   SetIndexDrawBegin(0,3*VelocityPeriod+Slow);
   SetIndexDrawBegin(1,3*VelocityPeriod+Slow);
//----
   return(0);
  }

//+------------------------------------------------------------------+
//| Velocity_v2                                                      |
//+------------------------------------------------------------------+
int start()
  {
   int    shift, limit, counted_bars=IndicatorCounted();

   if ( counted_bars < 0 ) return(-1);
   if ( counted_bars ==0 ) limit=Bars-3*VelocityPeriod-Slow-1;
   if ( counted_bars < 1 )

   for(int i=1;i<3*VelocityPeriod+Slow;i++)
   {
   Vel[Bars-i]=0;
   AvgVel[Bars-i]=0;
   DbAvgVel[Bars-i]=0;
   FastBuffer[Bars-i]=0;
   SlowBuffer[Bars-i]=0;
   }

   if(counted_bars>0) limit=Bars-counted_bars;
   limit--;

	for(shift=limit;shift>=0;shift--)
   Vel[shift]=(Close[shift]-Close[shift+1])/Point;
   for(shift=limit;shift>=0;shift--)
   AvgVel[shift]=iMAOnArray(Vel,0,VelocityPeriod,0,MA_Mode,shift);
   for(shift=limit;shift>=0;shift--)
   DbAvgVel[shift]=iMAOnArray(AvgVel,0,VelocityPeriod,0,MA_Mode,shift);
   for(shift=limit;shift>=0;shift--)
   FastBuffer[shift]=iMAOnArray(DbAvgVel,0,VelocityPeriod,0,MA_Mode,shift);
	for(shift=limit;shift>=0;shift--)
   SlowBuffer[shift]=iMAOnArray(FastBuffer,0,Slow,0,MA_Mode,shift);

	return(0);
 }
Comments