VininI_Trend_LRMA
Download script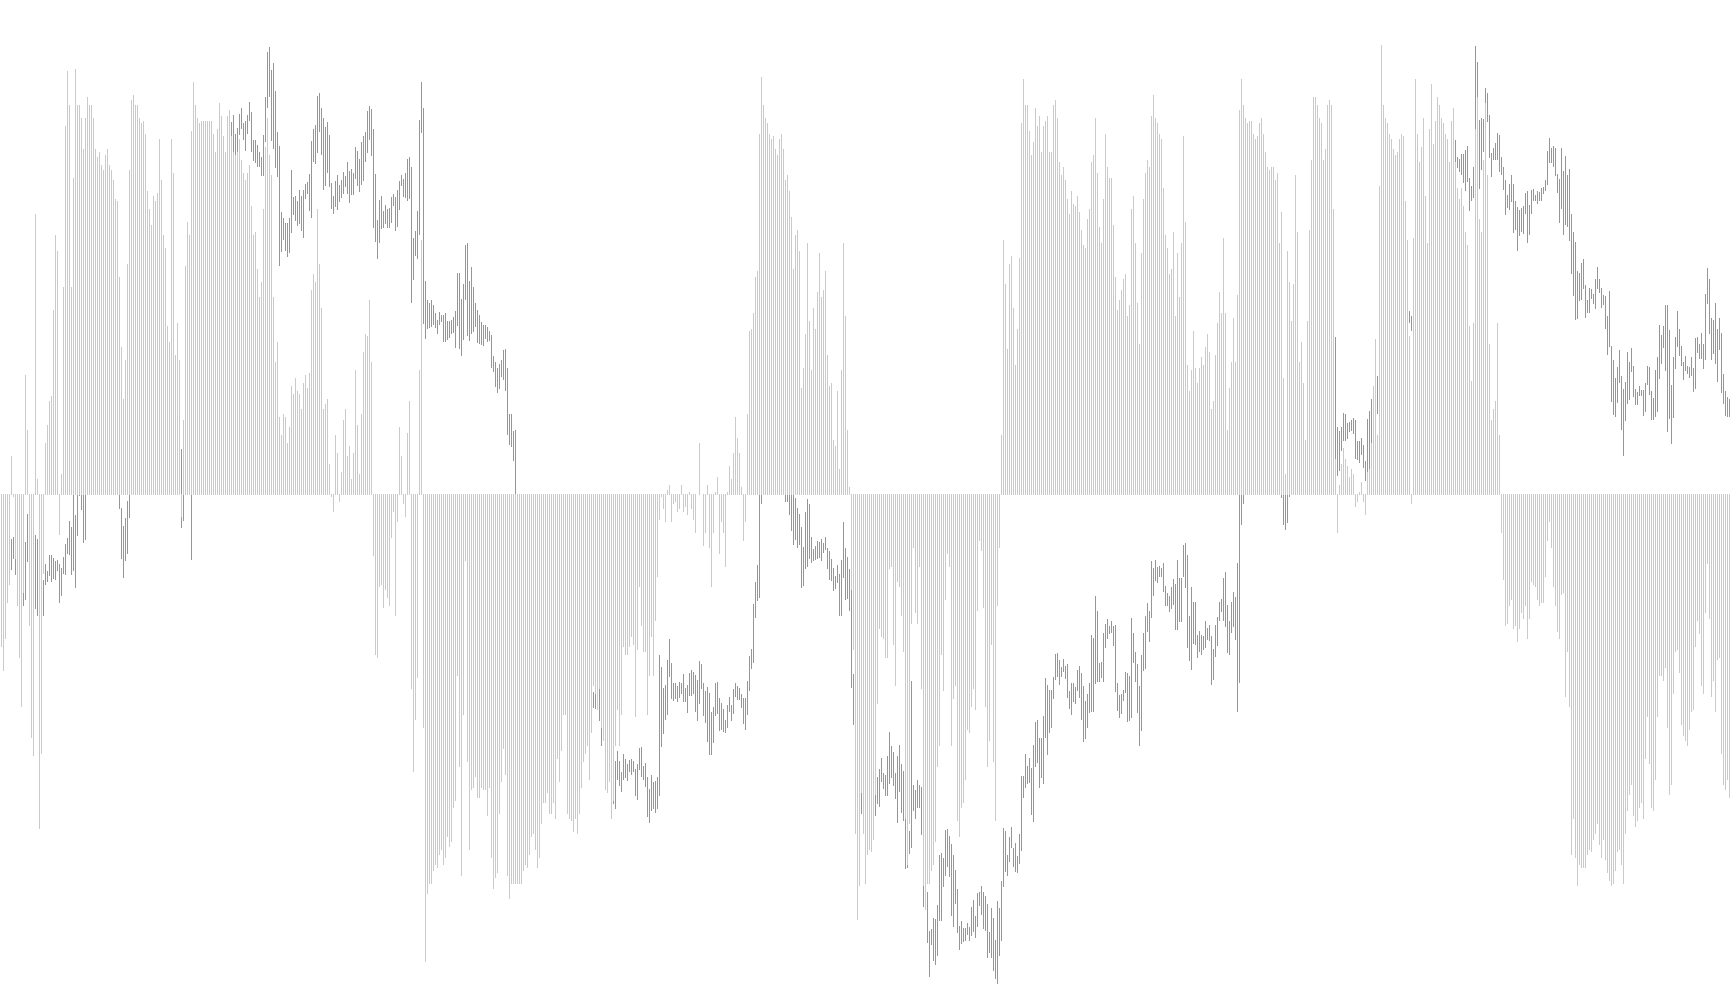
This tool is designed to analyze market trends by evaluating the relationship between multiple moving averages simultaneously. Instead of relying on a single indicator, it creates a comprehensive "trend score" that helps visualize the prevailing momentum of the market.
Core Logic Overview
The script operates through a multi-layered calculation process:
1. The Foundation: LRMA Calculation At its core, the tool uses a specialized logic called "LRMA." This isn't a standard moving average; it is a hybrid calculation that combines two different types of averages (Linear Weighted and Simple Moving Averages). By blending these two methods, the indicator attempts to balance responsiveness to recent price changes with the stability of long-term trends.
2. The Comparison Engine (The Trend Score) The tool does not just look at one value. It takes a large batch of moving averages (defined by the user as a specific count and step) and compares them against each other.
- For every moving average in this group, the script checks if its value is higher or lower than the primary reference point.
- It assigns a positive point for "upward" relative strength and a negative point for "downward" relative strength.
- The final result is an average score. If the score is high, it suggests that the vast majority of moving averages are aligned in an upward direction; if it is low, they are aligned downward.
3. The Smoothing Layer To make this data easier for a human trader to read, the script applies a final smoothing pass. It takes that "Trend Score" and runs it through one last calculation (either another LRMA or a standard Simple Moving Average). This filters out market "noise" and jitter, producing a smoother visual line or histogram.
How it appears on your chart
The result is displayed in a separate window below your main price chart. Rather than showing you the price itself, it shows you the strength of the trend.
- Positive Values: Indicate that the "consensus" among the various moving averages is bullish (upward).
- Negative Values: Indicate that the "consensus" among the various moving averages is bearish (downward).
- Zero Line: Acts as the equilibrium point where the market is in a state of transition or neutrality.
By looking at this tool, you can quickly see if the broad market sentiment is currently tilting toward the upside or downside based on a wide net of historical price data.
//+------------------------------------------------------------------+
//|                                            VininI_Trend_LRMA.mq4 |
//|                                  Ñopyright 2008. Victor Nicolaev |
//|                                                    vinin@mail.ru |
//+------------------------------------------------------------------+
#property copyright "Ñopyright 2008. Victor Nicolaev"
#property link      "vinin@mail.ru"


#property indicator_separate_window
#property indicator_buffers 1
#property indicator_color1 Orange
#property indicator_level1 0
#property indicator_maximum 1
#property indicator_minimum -1
#property indicator_width1 2

extern int MA_Start=10;
extern int MA_Step=10;
extern int MA_Count=50;
extern int MA_Mode=0;
extern int MA_Close=1;
extern int SignalSMA=3;
extern int Limit=1440;
extern bool LRMA_On=true;
//---- buffers
double Buffer[];
double Buffer0[];
//+------------------------------------------------------------------+
//| Ôóíêöèÿ LRMA îáùàÿ                                               |
//+------------------------------------------------------------------+
double LRMA(int periodMA, int shift)
  {
    double result=NormalizeDouble(3* iMA( NULL,0,periodMA,0, MODE_LWMA, PRICE_CLOSE, shift) -
                      2* iMA( NULL,0,periodMA,0, MODE_SMA, PRICE_CLOSE,shift),Digits);
    return(result);
  }
//+------------------------------------------------------------------+
//| Ôóíêöèÿ LRMAonArray                                              |
//+------------------------------------------------------------------+
double LRMAonArray(double Arr[], int periodMA,int shift)
  {
    double result=3* iMAOnArray(Arr,Bars,periodMA,0,MODE_LWMA,shift) -
                      2*iMAOnArray(Arr,Bars,periodMA,0,MODE_SMA,shift);
    return(result);
  }
//+------------------------------------------------------------------+
//| Custom indicator initialization function                         |
//+------------------------------------------------------------------+
int init() {
//---- drawing settings
   IndicatorBuffers(2);
   SetIndexStyle(0,DRAW_HISTOGRAM);
   SetIndexBuffer(0,Buffer);
   SetIndexBuffer(1,Buffer0);

   return(0); }//int init()

//+------------------------------------------------------------------+
int start() {
   int limit;
   int counted_bars=IndicatorCounted();
   int i,j;
   double sum=0;
   if(counted_bars<0) return(-1);
   if(counted_bars>0) counted_bars--;
   limit=Bars-counted_bars;
   if (Limit>0) limit=MathMin(Limit,limit);
   for (i = limit;i>=0;i--){
      sum=0;
      for (j=0;j<MA_Count;j++) if (LRMA(MA_Close,i)>LRMA(MA_Start+j*MA_Step,i)) sum+=1; else sum-=1;
      Buffer0[i]=sum/MA_Count;
   }

   for (i = limit;i>=0;i--)
   {
   if(LRMA_On)
      Buffer[i]=LRMAonArray(Buffer0,SignalSMA,i);
   else
      Buffer[i]=iMAOnArray(Buffer0,Bars,SignalSMA,0,MODE_SMA,i);
   }
   return(0);
}
Comments