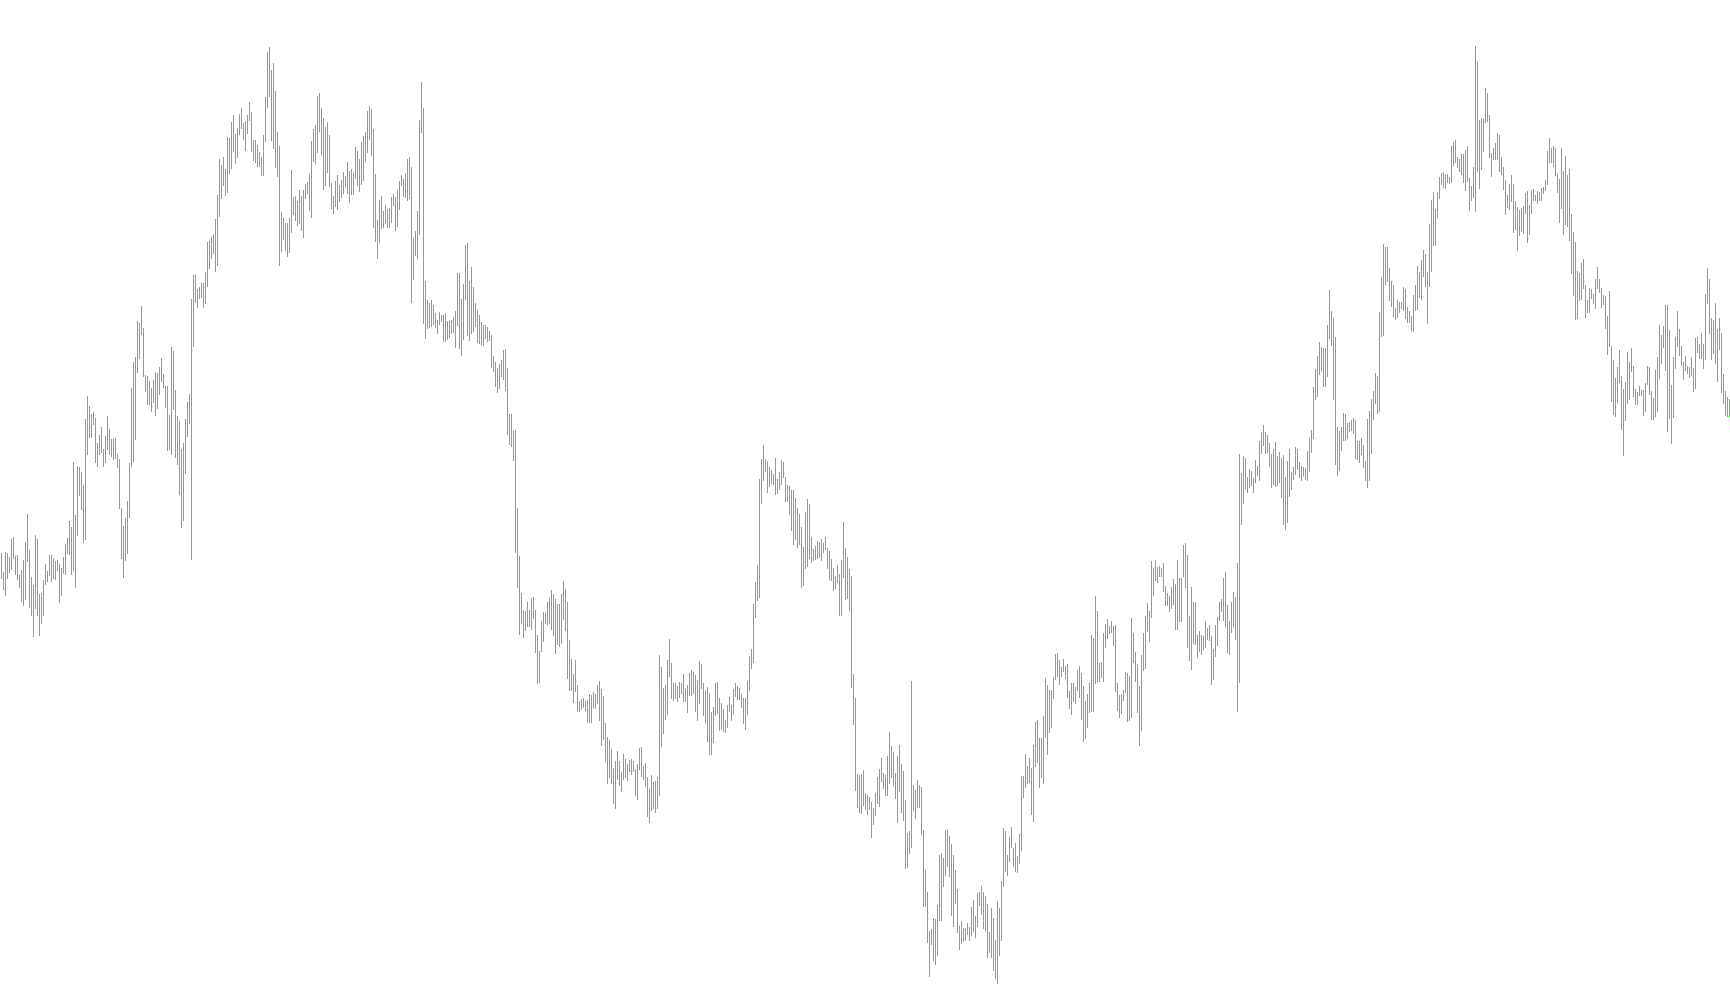
This script functions as a custom visual tool designed to be integrated into the MetaTrader trading platform. Its primary purpose is to create a dedicated viewing area below the main price chart, providing a structured environment for data visualization.
Core Functionality
The logic of this script focuses on setting up the visual infrastructure rather than performing complex mathematical calculations or automated trading actions. Here is how it behaves:
- Independent Display: The script establishes a "separate window" layout. This means that instead of drawing lines directly over your price candles, it creates a standalone sub-chart area. This is ideal for keeping specific data organized and clear from the main market movement.
- Visual Styling: It initializes two distinct visual elements, which are programmed to appear as solid histograms (vertical bars). These are designed to be displayed in a bright lime color, making them easily distinguishable against a standard trading background.
- Data Handling Setup: The script allocates space for two data streams. While the current logic serves as a foundational framework, it prepares the platform to record and display information across these two visual channels simultaneously.
- Scaling and Precision: It automatically adjusts its decimal precision to match the specific currency pair or asset you are currently viewing. This ensures that the visual representation remains consistent with the market's actual price increments.
Summary for Users
In essence, this script acts as a "template" or a visual foundation. It prepares your trading workspace by carving out a dedicated area and setting up the styling for two histogram bars. It ensures that the visual environment is correctly scaled and ready to display information clearly and consistently across different financial instruments.
//+------------------------------------------------------------------+
//|                                                      1-start.mq4 |
//|                                             Copyright © 2008, AP |
//|                                                   ekr-ap@mail.ru |
//+------------------------------------------------------------------+
#property copyright "Copyright © 2008, AP"
#property link      "ekr-ap@mail.ru"

#property indicator_separate_window
//+------------------------------------------------------------------+
//| Custom indicator initialization function                         |
//+------------------------------------------------------------------+

#property indicator_minimum -1
#property indicator_maximum 1
#property indicator_level1 0

#property indicator_buffers 2
#property indicator_color1 Lime
#property indicator_color2 Lime

extern int P=1;

double B[1000],A[1000];
int init()
  {
//---- indicators
//----
SetIndexBuffer(0,B);
SetIndexStyle(0,DRAW_HISTOGRAM,STYLE_SOLID,2);

SetIndexBuffer(1,A);
SetIndexStyle(1,DRAW_HISTOGRAM,STYLE_SOLID,2);

 IndicatorDigits(MarketInfo(Symbol(),MODE_DIGITS));
 WindowRedraw();
   return(0);
  }
//+------------------------------------------------------------------+
//| Custom indicator deinitialization function                       |
//+------------------------------------------------------------------+
int deinit()
  {
//----

//----
   return(0);
  }
//+------------------------------------------------------------------+
//| Custom indicator iteration function                              |
//+------------------------------------------------------------------+
int start()
  {
   int   i, counted_bars=IndicatorCounted();
//----
 /*
  for(i=0;i<Bars-counted_bars-1;i++) B[i]=50;
IndicatorDigits(MarketInfo(Symbol(),MODE_DIGITS));
 WindowRedraw();
   */
//----
   return(0);
  }
//+------------------------------------------------------------------+
Comments