Volumes
Download script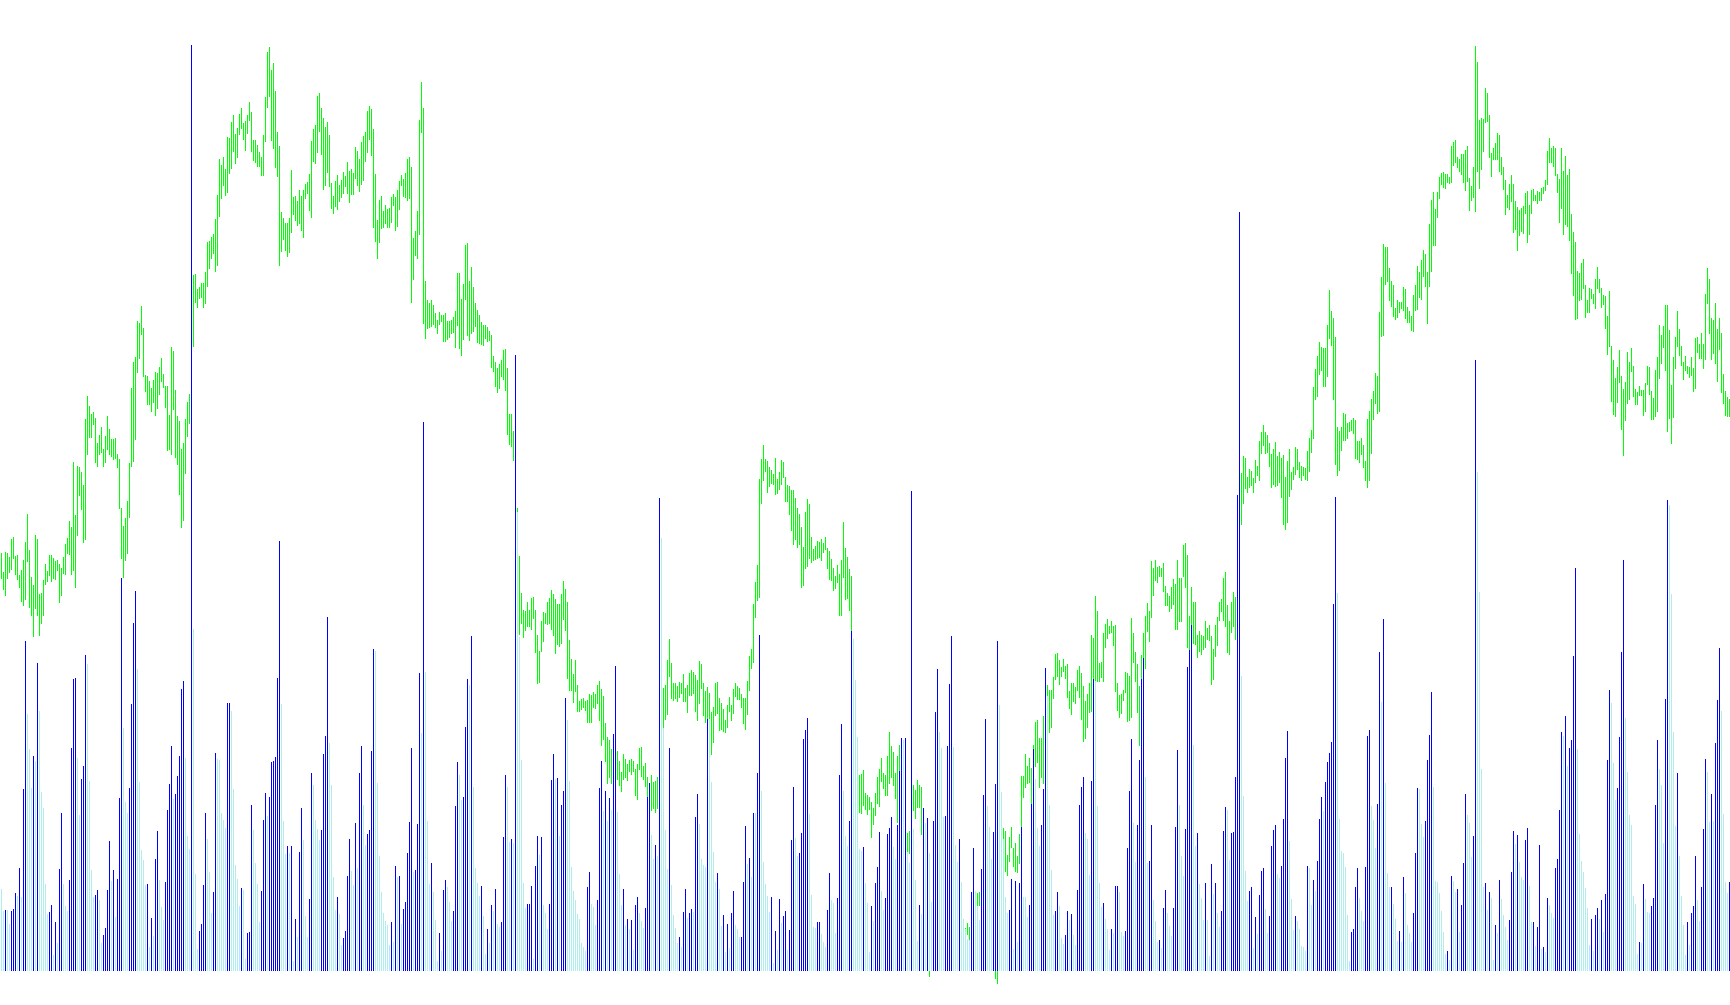
This tool is designed to provide a visual representation of trading volume on your charts, specifically focusing on the direction of market activity. Unlike standard volume indicators that might only show the total amount of trading for a period, this script categorizes volume into distinct visual categories to help traders identify who is in control of the price movement.
Core Functionality
The primary logic of the script involves comparing the current bar's volume against the preceding bar's volume. By analyzing these fluctuations, the tool automatically sorts the data into two visual streams: upward momentum and downward momentum.
How it Works
- Volume Detection: The script constantly monitors the total volume traded on each price bar.
- Momentum Comparison: It looks at the current volume level and compares it to the one immediately before it.
- Dynamic Categorization:
- If the current volume is higher than the previous bar's volume (or if it is the very first bar in the data set), the script identifies this as an "Up" movement. It assigns the data to a specific visual buffer meant for highlighting growth.
- If the current volume is lower than the previous bar's volume, the script interprets this as a "Down" movement. It then assigns that data to a separate visual buffer designed to show contraction or receding strength.
Visual Presentation
To make this information easy to read at a glance, the indicator uses a multi-colored histogram system:
- Distinct Coloring: The script uses different colors (specifically Green and Red) to differentiate between these two types of volume movements.
- Histogram Style: Instead of a simple line, it uses bars (histograms), which allows you to see the "weight" of the volume more clearly.
- Separate Window Display: The indicator operates in its own dedicated window at the bottom of your chart. This ensures that the visual data does not clutter your main price candles, allowing for a clean analysis of the underlying trading activity.
By using this logic, the tool helps traders visually distinguish between periods of increasing market participation and periods where volume is tapering off, providing a clearer picture of market sentiment and strength.
//+------------------------------------------------------------------+
//|                                                      Volumes.mq4 |
//|                      Copyright © 2005, MetaQuotes Software Corp. |
//|                                       http://www.metaquotes.net/ |
//+------------------------------------------------------------------+
#property copyright "Copyright © 2005, MetaQuotes Software Corp."
#property link      "http://www.metaquotes.net/"
//---- indicator settings
#property  indicator_separate_window
#property indicator_minimum 0
#property indicator_buffers 3
#property indicator_color1  Black
#property indicator_color2  Green
#property indicator_color3  Red
#property indicator_width2  2
#property indicator_width3  2
//---- indicator buffers
double ExtVolumesBuffer[];
double ExtVolumesUpBuffer[];
double ExtVolumesDownBuffer[];

//+------------------------------------------------------------------+
//| Custom indicator initialization function                         |
//+------------------------------------------------------------------+
int init()
  {
//---- indicator buffers mapping
   SetIndexBuffer(0,ExtVolumesBuffer);
   SetIndexBuffer(1,ExtVolumesUpBuffer);
   SetIndexBuffer(2,ExtVolumesDownBuffer);
//---- drawing settings
   SetIndexStyle(0,DRAW_NONE);
   SetIndexStyle(1,DRAW_HISTOGRAM);
   SetIndexStyle(2,DRAW_HISTOGRAM);
//---- sets default precision format for indicators visualization
   IndicatorDigits(0);
//---- name for DataWindow and indicator subwindow label
   IndicatorShortName("Volumes");
   SetIndexLabel(0,"Volumes");
   SetIndexLabel(1,NULL);
   SetIndexLabel(2,NULL);
//---- sets drawing line empty value
   SetIndexEmptyValue(1,0.0);
   SetIndexEmptyValue(2,0.0);
//---- initialization done
   return(0);
  }
//+------------------------------------------------------------------+
//| Volumes                                                          |
//+------------------------------------------------------------------+
int start()
  {
   int    i,nLimit,nCountedBars;
//---- bars count that does not changed after last indicator launch.
   nCountedBars=IndicatorCounted();
//---- last counted bar will be recounted
   if(nCountedBars>0) nCountedBars--;
   nLimit=Bars-nCountedBars;
//----
   for(i=0; i<nLimit; i++)
     {
      double dVolume=Volume[i];
      if(i==Bars-1 || dVolume>Volume[i+1])
        {
         ExtVolumesBuffer[i]=dVolume;
         ExtVolumesUpBuffer[i]=dVolume;
         ExtVolumesDownBuffer[i]=0.0;
        }
      else
        {
         ExtVolumesBuffer[i]=dVolume;
         ExtVolumesUpBuffer[i]=0.0;
         ExtVolumesDownBuffer[i]=dVolume;
        }
     }
//---- done
   return(0);
  }
//+------------------------------------------------------------------+
Comments