Waddah_Attar_ADXxBollinger
Download script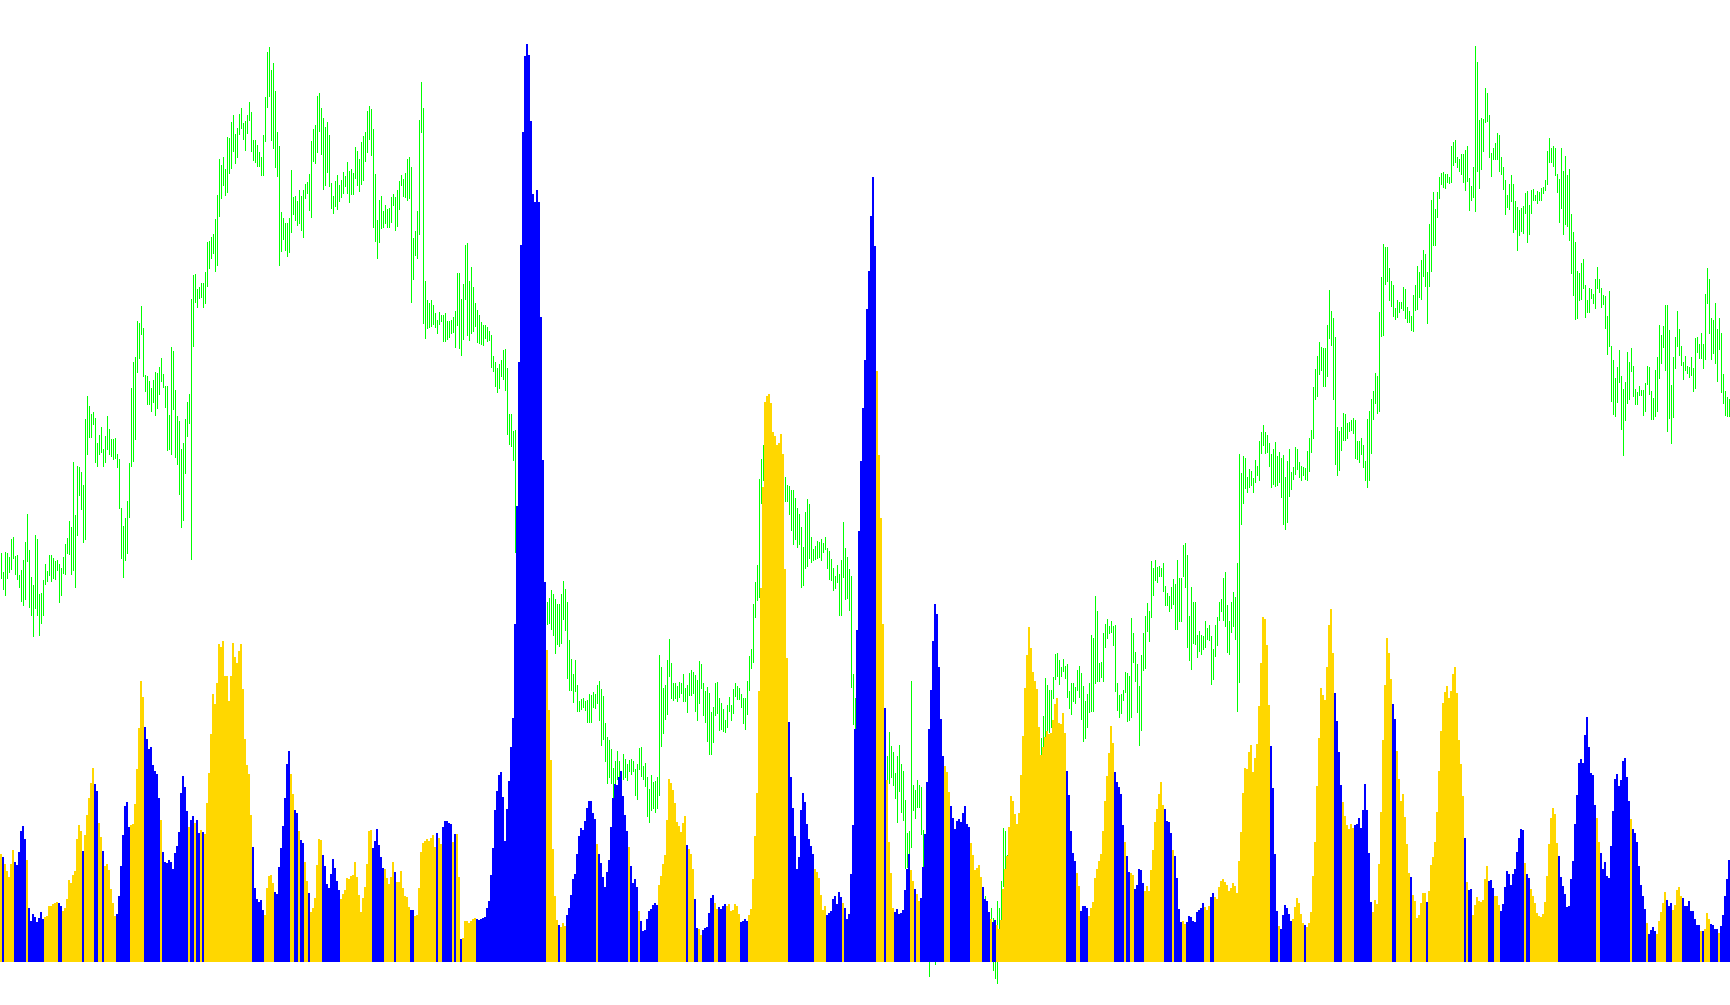
This custom indicator combines two well-known technical analysis tools to help traders identify the strength and direction of market trends more clearly. By merging the "ADX" (Average Directional Index) with "Bollinger Bands," the script creates a visual representation of momentum that is easier to interpret than looking at either tool in isolation.
How the Logic Works
The script operates by calculating three primary pieces of information from the market data:
- Trend Strength: It looks at the ADX to determine how powerful the current trend is.
- Directional Movement: It separates this strength into two categories—upward movement (Positive Direction) and downward movement (Negative Direction).
- Market Volatility: It measures the "width" of the Bollinger Bands, which tells the script how much the price is expanding or contracting at any given moment.
The Core Calculation
The indicator performs a multi-step calculation to generate its visual output:
- Measuring the Spread: Instead of just looking at the price, the script calculates the distance between the upper and lower Bollinger Bands. This represents the "range" or the space in which the market is currently moving.
- Filtering for Direction: The script then checks whether the upward momentum is stronger than the downward momentum.
- The Final Output: It multiplies the Trend Strength (ADX) by the Market Volatility (Bollinger Band range). This creates a "weighted" histogram.
What it Shows on Your Chart
The result is displayed in a separate window as a dual-colored histogram:
- Green Histogram: Appears when the upward momentum is dominant. The height of the bars indicates a combination of strong trend power and high market volatility.
- Red Histogram: Appears when the downward momentum is dominant. Similarly, the height represents how much "force" is behind that move combined with the current price range.
In simple terms, this script helps you ignore "noisy" sideways markets. It highlights periods where there is significant movement in a specific direction, showing you not just where the market is going, but how aggressively it is moving there.
//+------------------------------------------------------------------+
//|                                   Waddah Attar ADXxBollinger.mq4 |
//|                              Copyright © 2006, Eng. Waddah Attar |
//|                                          waddahattar@hotmail.com |
//+------------------------------------------------------------------+
#property copyright "Waddah Attar www.metaforex.net"
#property link      "www.metaforex.net waddahattar@hotmail.com"
//----
#property indicator_separate_window
#property indicator_buffers 2
#property indicator_color1 Green
#property indicator_color2 Red
#property indicator_minimum 0
//----
extern int ADXPeriod = 13;
extern int BandsPeriod=20;
//----
double ExtBuffer1[];
double ExtBuffer2[];
//+------------------------------------------------------------------+
//|                                                                  |
//+------------------------------------------------------------------+
int init()
  {
   SetIndexBuffer(0, ExtBuffer1);
   SetIndexStyle(0, DRAW_HISTOGRAM, 0, 2);
//----
   SetIndexBuffer(1, ExtBuffer2);
   SetIndexStyle(1, DRAW_HISTOGRAM, 0, 2);
//----
   IndicatorShortName("Waddah Attar ADXxBollinger - ADX (" + ADXPeriod + ") x Bollinger ("+BandsPeriod+")");
   return(0);
  }
//+------------------------------------------------------------------+
//|                                                                  |
//+------------------------------------------------------------------+
int start()
  {
   int i, limit;
   double ADX0,ADX1,ADX2,Explo;
   int counted_bars = IndicatorCounted();
   if(counted_bars < 0)
       return(-1);
   if(counted_bars > 0)
       counted_bars--;
   limit = Bars - counted_bars;
//----
   for(i = 0; i < limit ; i++)
     {
       ADX0 = iADX(NULL, 0, ADXPeriod, PRICE_WEIGHTED, MODE_MAIN, i);
       ADX1 = iADX(NULL, 0, ADXPeriod, PRICE_WEIGHTED, MODE_PLUSDI, i);
       ADX2 = iADX(NULL, 0, ADXPeriod, PRICE_WEIGHTED, MODE_MINUSDI, i);
       Explo = (iBands(NULL, 0, BandsPeriod, 2, 0, PRICE_CLOSE, MODE_UPPER, i) -
                iBands(NULL, 0, BandsPeriod, 2, 0, PRICE_CLOSE, MODE_LOWER, i));

       //----
       if(ADX1 >= ADX2)
         {
           ExtBuffer1[i] = ADX0*Explo;
           ExtBuffer2[i] = 0;
         }
       else
         {
           ExtBuffer1[i] = 0;
           ExtBuffer2[i] = ADX0*Explo;
         }
     }
   return(0);
  }
//+------------------------------------------------------------------+
Comments