WeeklyPivotOnly[1]
Download script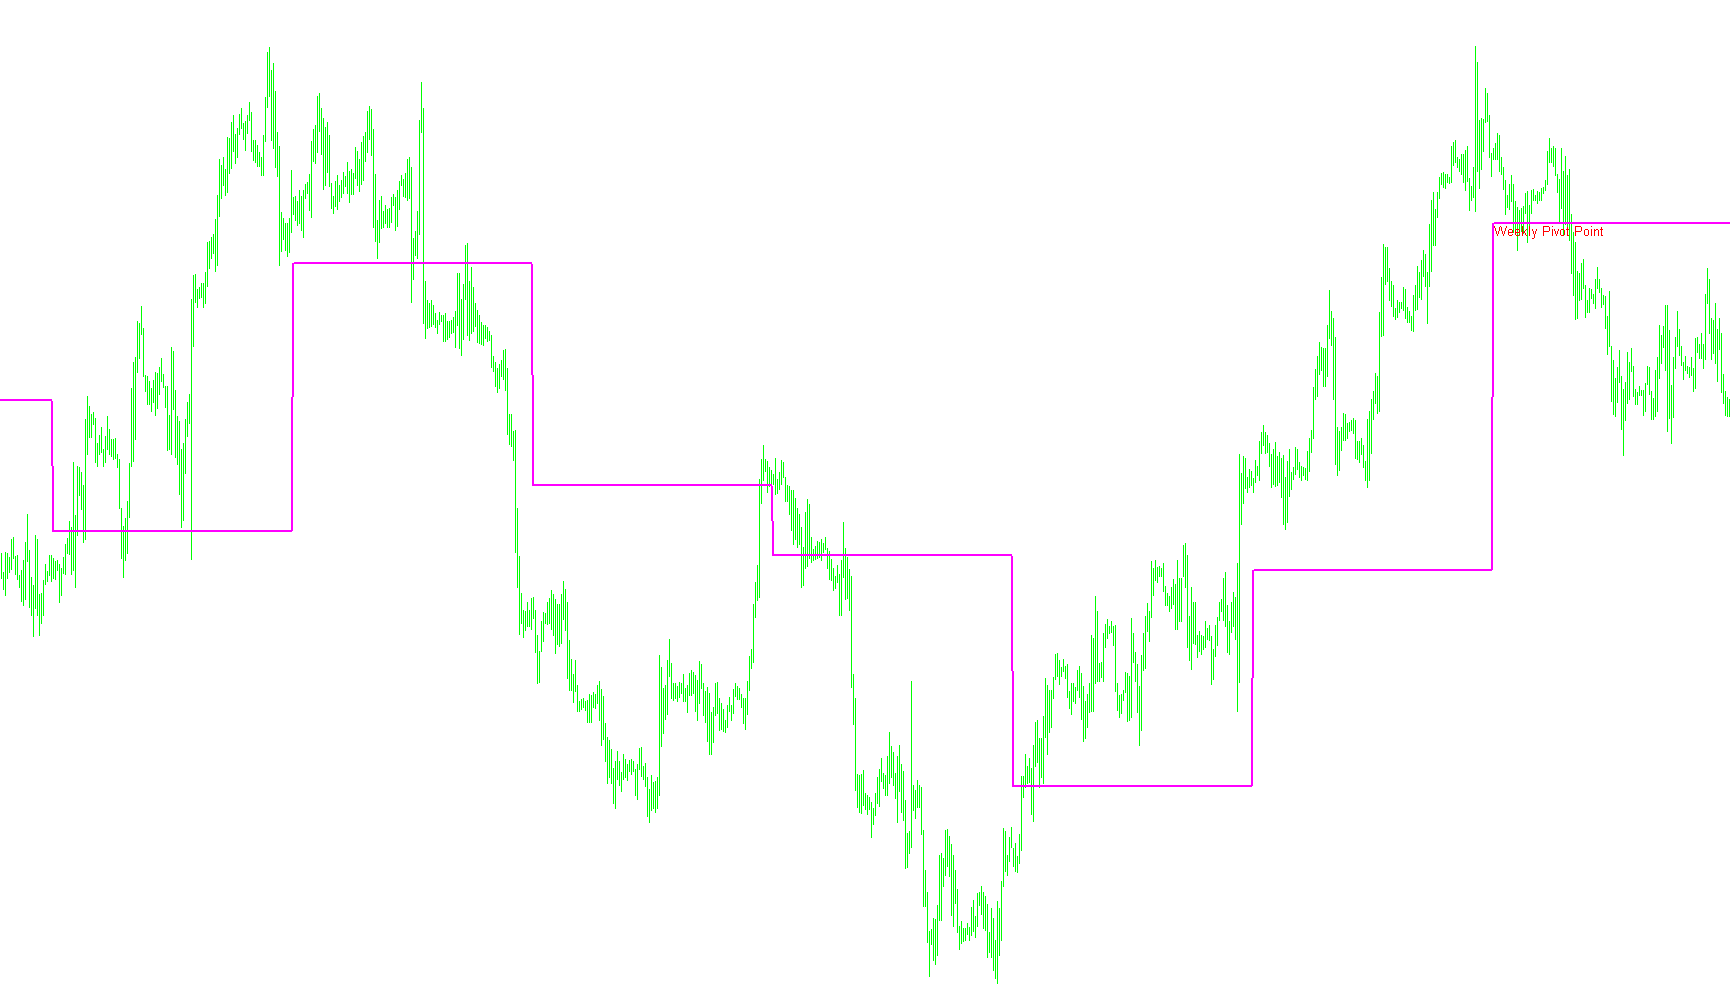
The Weekly Pivot Point indicator is a technical analysis tool designed to provide traders with clear visual benchmarks on their charts. It automatically calculates key price levels based on the previous week's market activity, helping identify potential areas of support and resistance for the current trading week.
Core Logic and Functionality
The script operates by analyzing historical price data to determine "Pivot Points." These points are essential for understanding market sentiment: they act as equilibrium markers where the price may experience a shift in direction or consolidation.
1. Identification of Key Data To calculate these levels, the script looks specifically for the start of a new week (every Monday). It gathers four specific pieces of data from the preceding week:
- The highest price reached (High)
- The lowest price reached (Low)
- The closing price of the previous week
- The opening price of the current week
2. Calculation of Pivot Levels Using these values, the script calculates a central Weekly Pivot Point. This acts as the "anchor" for the week. From this anchor, the indicator projects several specific support and resistance levels:
- Support Levels (S1, S2, S3): These represent price zones where buying interest is expected to increase, potentially preventing the price from falling further.
- Resistance Levels (R1, R2, R3): These represent price zones where selling pressure may intensify, potentially preventing the price from rising further.
3. Dynamic Visual Updates The indicator does not remain static; it is designed to be dynamic. As the current week progresses:
- It continuously tracks the new highs and lows being established in real-time.
- It automatically updates the visual lines on your chart so that you can see the evolving market structure.
- It applies distinct color coding (such as Magenta, Royal Blue, Crimson, and SeaGreen) to differentiate between various support and resistance tiers, allowing for easy identification at a glance.
How it Benefits the Trader
Instead of manually calculating complex formulas every morning, this script automates the process. It provides a roadmap of "zones of interest." By watching how the price interacts with these lines—whether it bounces off a Support level or struggles to break through a Resistance level—traders can make more informed decisions regarding entry and exit points for their trades.
//+------------------------------------------------------------------+
//|                                                  WeeklyPivot.mq4 |
//|                                                                  |
//+------------------------------------------------------------------+

#property indicator_chart_window
#property indicator_buffers 7
#property indicator_color1 Magenta
#property indicator_color2 RoyalBlue
#property indicator_color3 Crimson
#property indicator_color4 RoyalBlue
#property indicator_color5 Crimson
#property indicator_color6 SeaGreen
#property indicator_color7 SeaGreen
//---- input parameters

//---- buffers
double PBuffer[];
double S1Buffer[];
double R1Buffer[];
double S2Buffer[];
double R2Buffer[];
double S3Buffer[];
double R3Buffer[];
string Pivot="WeeklyPivotPoint",Sup1="W_S 1", Res1="W_R 1";
string Sup2="W_S 2", Res2="W_R 2", Sup3="W_S 3", Res3="W_R 3";
int fontsize=10;
double P,S1,R1,S2,R2,S3,R3;
double last_week_high, last_week_low, this_week_open, last_week_close;

//+------------------------------------------------------------------+
//| Custor indicator deinitialization function                       |
//+------------------------------------------------------------------+
int deinit()
  {
//---- TODO: add your code here

   ObjectDelete("WeeklyPivot");
   ObjectDelete("Sup1");
   ObjectDelete("Res1");
   ObjectDelete("Sup2");
   ObjectDelete("Res2");
   ObjectDelete("Sup3");
   ObjectDelete("Res3");

//----
   return(0);
  }
//+------------------------------------------------------------------+
//| Custom indicator initialization function                         |
//+------------------------------------------------------------------+
int init()
  {
   string short_name;


//---- indicator line
   SetIndexStyle(0,DRAW_LINE,0,2,Magenta);
   SetIndexStyle(1,DRAW_LINE,0,2,RoyalBlue);
   SetIndexStyle(2,DRAW_LINE,0,2,Crimson);
   SetIndexStyle(3,DRAW_LINE,0,2,RoyalBlue);
   SetIndexStyle(4,DRAW_LINE,0,2,Crimson);
   SetIndexStyle(5,DRAW_LINE,0,2,SeaGreen);
   SetIndexStyle(6,DRAW_LINE,0,2,SeaGreen);
   SetIndexBuffer(0,PBuffer);
   SetIndexBuffer(1,S1Buffer);
   SetIndexBuffer(2,R1Buffer);
   SetIndexBuffer(3,S2Buffer);
   SetIndexBuffer(4,R2Buffer);
   SetIndexBuffer(5,S3Buffer);
   SetIndexBuffer(6,R3Buffer);


//---- name for DataWindow and indicator subwindow label
   short_name="WeeklyPivotPoint";
   IndicatorShortName(short_name);
   SetIndexLabel(0,short_name);

//----
   SetIndexDrawBegin(0,1);
//----


//----
   return(0);
  }

//+------------------------------------------------------------------+
//| Custom indicator iteration function                              |
//+------------------------------------------------------------------+
int start()

  {
   int counted_bars=IndicatorCounted();

   int limit, i;
//---- indicator calculation
if (counted_bars==0)
{

   ObjectCreate("WeeklyPivot", OBJ_TEXT, 0, 0,0);
   ObjectSetText("WeeklyPivot", "                            Weekly Pivot Point",fontsize,"Arial",Red);
   ObjectCreate("Sup1", OBJ_TEXT, 0, 0, 0);
   ObjectSetText("Sup1", "        wS 1",fontsize,"Arial",Red);
   ObjectCreate("Res1", OBJ_TEXT, 0, 0, 0);
   ObjectSetText("Res1", "        wR 1",fontsize,"Arial",Red);
   ObjectCreate("Sup2", OBJ_TEXT, 0, 0, 0);
   ObjectSetText("Sup2", "        wS 2",fontsize,"Arial",Red);
   ObjectCreate("Res2", OBJ_TEXT, 0, 0, 0);
   ObjectSetText("Res2", "        wR 2",fontsize,"Arial",Red);
   ObjectCreate("Sup3", OBJ_TEXT, 0, 0, 0);
   ObjectSetText("Sup3", "        wS 3",fontsize,"Arial",Red);
   ObjectCreate("Res3", OBJ_TEXT, 0, 0, 0);
   ObjectSetText("Res3", "        wR 3",fontsize,"Arial",Red);
}
   if(counted_bars<0) return(-1);

   limit=(Bars-counted_bars)-1;


for (i=limit; i>=0;i--)
{


   // Monday
	if ( 1 == TimeDayOfWeek(Time[i]) && 1 != TimeDayOfWeek(Time[i+1]) )
	{
		last_week_close = Close[i+1];
		this_week_open = Open[i];

		// WeeklyPivot
		P = (last_week_high + last_week_low + this_week_open + last_week_close) / 4;

   //R1 = (2*P)-last_week_low;
   //S1 = (2*P)-last_week_high;
   //R2 = P+(last_week_high - last_week_low);
   //S2 = P-(last_week_high - last_week_low);
   //R3 = (2*P)+(last_week_high-(2*last_week_low));
   //S3 = (2*P)-((2* last_week_high)-last_week_low);

   last_week_low=Low[i]; last_week_high=High[i];

	ObjectMove("WeeklyPivot", 0, Time[i],P);
   ObjectMove("Sup1", 0, Time[i],S1);
   ObjectMove("Res1", 0, Time[i],R1);
   ObjectMove("Sup2", 0, Time[i],S2);
   ObjectMove("Res2", 0, Time[i],R2);
   ObjectMove("Sup3", 0, Time[i],S3);
   ObjectMove("Res3", 0, Time[i],R3);

}

    last_week_high = MathMax(last_week_high, High[i]);
 	 last_week_low = MathMin(last_week_low, Low[i]);
    PBuffer[i]=P;
    S1Buffer[i]=S1;
    R1Buffer[i]=R1;
    S2Buffer[i]=S2;
    R2Buffer[i]=R2;
    S3Buffer[i]=S3;
    R3Buffer[i]=R3;

}

//----
   return(0);
  }
//+------------------------------------------------------------------+
Comments