Pivots_Weekly
Download script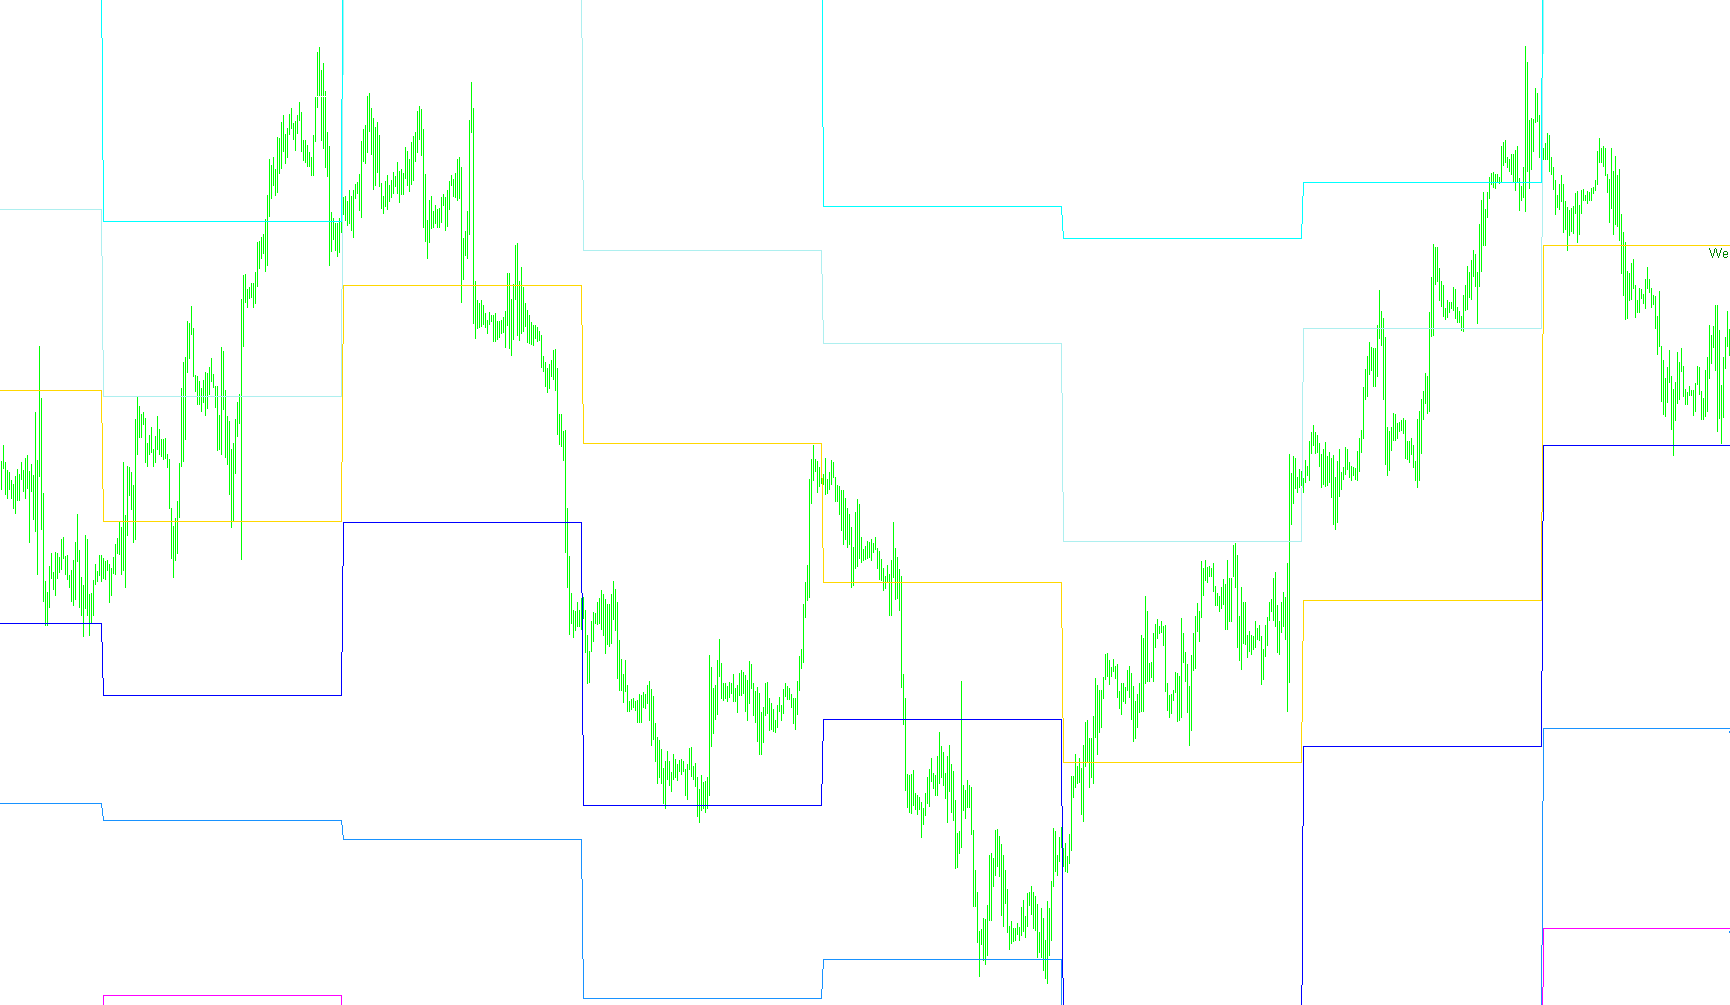
This script is designed to provide traders with a visual roadmap of key price levels on a trading chart. Specifically, it automates the calculation and display of Weekly Pivot Points, which are essential technical analysis tools used to identify potential areas of support (where prices might stop falling) and resistance (where prices might stop rising).
Core Functionality
The logic focuses on identifying the "turning points" for the week based on the price action of the previous week. Every Monday, the script scans the market data to extract three vital pieces of information from the prior week: the highest price reached, the lowest price reached, and the closing price.
How the Logic Works
Once the script identifies the start of a new week (Monday), it performs a series of mathematical calculations to generate seven distinct price levels:
- The Pivot Point: This is the central equilibrium point for the week. It is calculated by taking the average of last week's high, low, and closing prices.
- Support Levels (S1, S2, S3): These represent three different "floors." As the price drops, these levels indicate zones where buyers are historically likely to step in. The script calculates these progressively deeper as you move from S1 to S3.
- Resistance Levels (R1, R2, R3): These represent three different "ceilings." As the price climbs, these levels indicate zones where sellers are likely to become active and push the price back down. Like the support levels, these are calculated to be progressively higher from R1 to R3.
Visual Features
Beyond just calculating the numbers, the script is designed to be user-friendly for active trading:
- Dynamic Labeling: The script automatically places text labels directly on your chart. This allows you to see the exact price of each Pivot, Support, and Resistance level at a glance without having to do any manual math.
- Customizable Styling: Users can adjust the colors of these labels (e.g., different colors for support vs. resistance) and change the font size to ensure the information is clear and readable on any chart setup.
- Time Accuracy: The logic is specifically designed to remain consistent regardless of the broker's time settings, ensuring that the "Monday" transition is captured correctly for a smooth trading experience.
Summary for the Trader
Essentially, this tool acts as an automated analyst. It looks back at last week’s history, projects where the "battle lines" will be drawn for the current week, and paints those levels on your screen so you can make more informed decisions on when to enter or exit a trade.
//+------------------------------------------------------------------+
//|                                                  WeeklyPivot.mq4 |
//|  I found the original indicator in TSD forum posted by heliyaun. |
//|                                       I don´t know how wrote it. |
//| I like it because have mondays fixed for broker with GMT outside |
//| london time.                                                     |
//| So, I added some stuff, labels, fix, etc. and them, I wrote the|
//|             Medians SR, and then, I wrote the same for Monthlies |
//|                                                                  |
//|                                                           Enjoy. |
//|                                                                  |
//|                                           Linuxser, January 2007 |
//|                                                                  |
//+------------------------------------------------------------------+

#property indicator_chart_window
#property indicator_buffers 7
#property indicator_color1 Magenta
#property indicator_color2 Teal
#property indicator_color3 RoyalBlue
#property indicator_color4 SeaGreen
#property indicator_color5 CornflowerBlue
#property indicator_color6 MediumSeaGreen
#property indicator_color7 LightSkyBlue

//---- input parameters

extern color     SupportLabelColor=DodgerBlue;
extern color     ResistanceLabelColor=Teal;
extern color     PivotLabelColor=Green;
extern int       fontsize=10;
extern int       LabelShift = 0;

//---- buffers
double PBuffer[];
double S1Buffer[];
double R1Buffer[];
double S2Buffer[];
double R2Buffer[];
double S3Buffer[];
double R3Buffer[];
string Pivot="WeeklyPivotPoint",Sup1="W_S 1", Res1="W_R 1";
string Sup2="W_S 2", Res2="W_R 2", Sup3="W_S 3", Res3="W_R 3";
double P,S1,R1,S2,R2,S3,R3;
double last_week_high, last_week_low, this_week_open, last_week_close;
datetime LabelShiftTime;
//+------------------------------------------------------------------+
//| Custor indicator deinitialization function                       |
//+------------------------------------------------------------------+
int deinit()
  {
//---- TODO: add your code here

   ObjectDelete("WeeklyPivot");
   ObjectDelete("WSup1");
   ObjectDelete("WRes1");
   ObjectDelete("WSup2");
   ObjectDelete("WRes2");
   ObjectDelete("WSup3");
   ObjectDelete("WRes3");

//----
   return(0);
  }
//+------------------------------------------------------------------+
//| Custom indicator initialization function                         |
//+------------------------------------------------------------------+
int init()
  {
   string short_name;


//---- indicator line
   SetIndexStyle(0,DRAW_LINE,EMPTY);
   SetIndexStyle(1,DRAW_LINE,EMPTY);
   SetIndexStyle(2,DRAW_LINE,EMPTY);
   SetIndexStyle(3,DRAW_LINE,EMPTY);
   SetIndexStyle(4,DRAW_LINE,EMPTY);
   SetIndexStyle(5,DRAW_LINE,EMPTY);
   SetIndexStyle(6,DRAW_LINE,EMPTY);
   SetIndexBuffer(0,PBuffer);
   SetIndexBuffer(1,S1Buffer);
   SetIndexBuffer(2,R1Buffer);
   SetIndexBuffer(3,S2Buffer);
   SetIndexBuffer(4,R2Buffer);
   SetIndexBuffer(5,S3Buffer);
   SetIndexBuffer(6,R3Buffer);


//---- name for DataWindow and indicator subwindow label
   short_name="Pivot Point Weekly";
   IndicatorShortName(short_name);
   SetIndexLabel(0,short_name);

//----
   SetIndexDrawBegin(0,1);
//----


//----
   return(0);
  }

//+------------------------------------------------------------------+
//| Custom indicator iteration function                              |
//+------------------------------------------------------------------+
int start()

  {
   int counted_bars=IndicatorCounted();

   int limit, i;
//---- indicator calculation
if (counted_bars==0)
{
   if(Period() > 1440)
   {
   Print("Error - Chart period is greater than 1 day.");
   return(-1); // then exit
   }

}
   if(counted_bars<0) return(-1);

   limit=(Bars-counted_bars)-1;


for (i=limit; i>=0;i--)
{


   // Monday
	if ( 1 == TimeDayOfWeek(Time[i]) && 1 != TimeDayOfWeek(Time[i+1]) )
	{
		last_week_close = Close[i+1];
		this_week_open = Open[i];

		// WeeklyPivot
	P = (last_week_high + last_week_low + last_week_close) / 3;

   R1 = (2*P)-last_week_low;
   S1 = (2*P)-last_week_high;
   R2 = P+(last_week_high - last_week_low);
   S2 = P-(last_week_high - last_week_low);
   R3 = (2*P)+(last_week_high-(2*last_week_low));
   S3 = (2*P)-((2* last_week_high)-last_week_low);

   last_week_low=Low[i]; last_week_high=High[i];

   LabelShiftTime = Time[LabelShift];

	ObjectCreate("WeeklyPivot", OBJ_TEXT, 0,LabelShiftTime,0);
   ObjectSetText("WeeklyPivot", "                            Weekly Pivot Point  "+DoubleToStr(P,4),fontsize,"Arial",PivotLabelColor);
   SetIndexLabel(0, "W Pivot Point");
   ObjectCreate("WSup1", OBJ_TEXT, 0, 0, 0);
   ObjectSetText("WSup1", "                   W S1 "+DoubleToStr(S1,4),fontsize,"Arial",SupportLabelColor);
   SetIndexLabel(1, "WSup1");
   ObjectCreate("WRes1", OBJ_TEXT, 0, LabelShiftTime, 0);
   ObjectSetText("WRes1", "                   W R1  "+DoubleToStr(R1,4),fontsize,"Arial",ResistanceLabelColor);
   SetIndexLabel(2, "WRes1");
   ObjectCreate("WSup2", OBJ_TEXT, 0, LabelShiftTime, 0);
   ObjectSetText("WSup2", "                   W S2  "+DoubleToStr(S2,4),fontsize,"Arial",SupportLabelColor);
   SetIndexLabel(3, "WSup2");
   ObjectCreate("WRes2", OBJ_TEXT, 0, LabelShiftTime, 0);
   ObjectSetText("WRes2", "                   W R2  "+DoubleToStr(R2,4),fontsize,"Arial",ResistanceLabelColor);
   SetIndexLabel(4, "WWRes2");
   ObjectCreate("WSup3", OBJ_TEXT, 0, LabelShiftTime, 0);
   ObjectSetText("WSup3", "                   W S3  "+DoubleToStr(S3,4),fontsize,"Arial",SupportLabelColor);
   SetIndexLabel(5, "WSup3");
   ObjectCreate("WRes3", OBJ_TEXT, 0, LabelShiftTime, 0);
   ObjectSetText("WRes3", "                   W R3  "+DoubleToStr(R3,4),fontsize,"Arial",ResistanceLabelColor);
	SetIndexLabel(6, "WRes3");
	ObjectMove("WeeklyPivot", 0, LabelShiftTime,P);
   ObjectMove("WSup1", 0, LabelShiftTime,S1);
   ObjectMove("WRes1", 0, LabelShiftTime,R1);
   ObjectMove("WSup2", 0, LabelShiftTime,S2);
   ObjectMove("WRes2", 0, LabelShiftTime,R2);
   ObjectMove("WSup3", 0, LabelShiftTime,S3);
   ObjectMove("WRes3", 0, LabelShiftTime,R3);

}

    last_week_high = MathMax(last_week_high, High[i]);
 	 last_week_low = MathMin(last_week_low, Low[i]);
    PBuffer[i]=P;
    S1Buffer[i]=S1;
    R1Buffer[i]=R1;
    S2Buffer[i]=S2;
    R2Buffer[i]=R2;
    S3Buffer[i]=S3;
    R3Buffer[i]=R3;

}

//----
   return(0);
  }
//+------------------------------------------------------------------+
Comments