Wick-O-Gram
Download script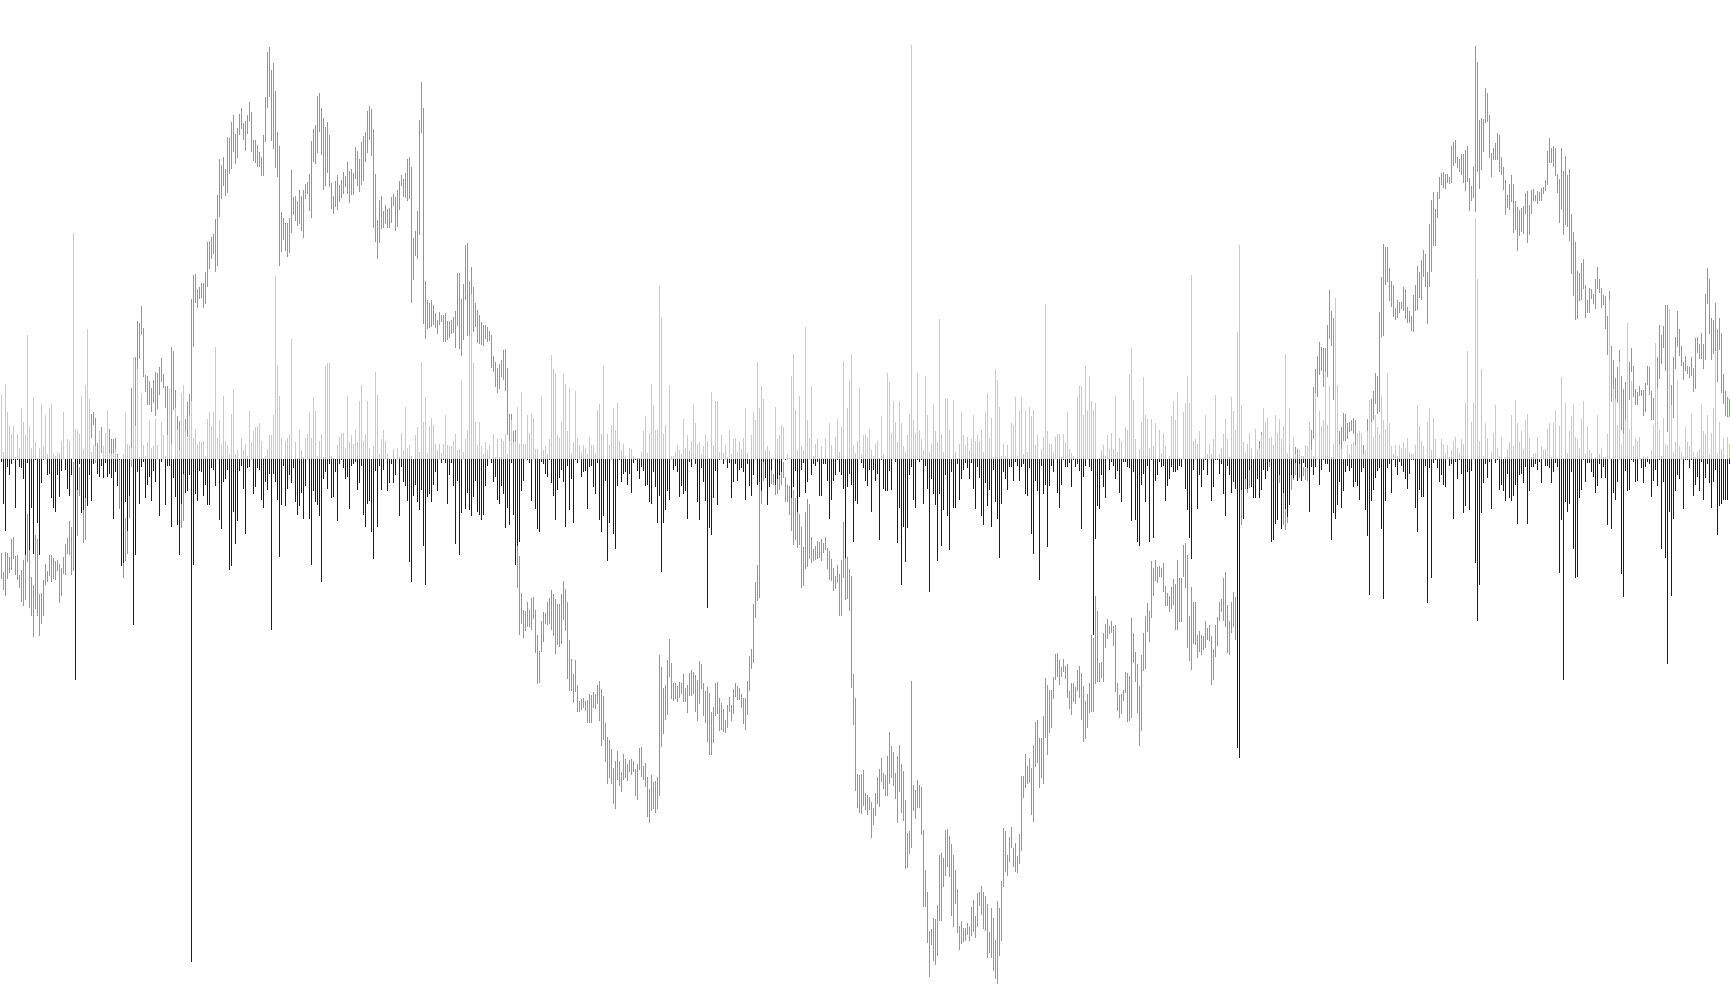
This tool is designed to provide a visual representation of price "wicks" on a trading chart. In technical analysis, a wick represents the price movement that occurred during a specific timeframe but was ultimately rejected, leaving behind a small line rather than a full-bodied candle. This script measures those movements to help traders identify market volatility and potential rejection zones.
Core Functionality
The indicator operates by scanning each individual price bar on your chart and calculating two distinct types of movements: the "Upper Wick" and the "Lower Wick."
1. Upper Wick Measurement The logic identifies the highest point reached during a period and compares it against the opening and closing prices. It determines which of those two values is lower to calculate the maximum distance the price traveled upward from the "body" of the candle.
2. Lower Wick Measurement Similarly, the logic identifies the lowest point reached and compares it against the opening and closing prices. It calculates the distance the price traveled downward from the "body" of the candle.
Visual Output
Instead of appearing directly on the main price chart, this indicator creates a separate window below your main view. It displays the results as a dual-histogram:
- Green Histograms: These represent the magnitude of the upper wicks.
- Red Histograms: These represent the magnitude of the lower wicks.
Key Features for Accuracy
- Standardized Scaling: The script includes an automatic detection system for different broker types (specifically handling 3-digit and 5-digit pricing). This ensures that the measurements are converted into standard "Pips," providing a consistent look regardless of which currency pair or broker you are using.
- Real-Time Calculation: The logic processes the history of the chart from the oldest bar to the most recent, ensuring that as new candles form, the histogram updates to reflect the current market action immediately.
By viewing this indicator, a trader can quickly see at a glance whether the market is experiencing significant "rejections" (long wicks) or if the price is moving with steady conviction (short wicks), helping to gauge the strength of buyers versus sellers.
//+------------------------------------------------------------------+

//| Wick.mq4 |

//| Seavo |

//| http://www.forexfactory.com/member.php?u=17692 |

//+------------------------------------------------------------------+

#property copyright "Seavo"

#property link "http://www.forexfactory.com/member.php?u=17692"

#property indicator_separate_window

#property indicator_buffers 2

#property indicator_color1 Green
#property indicator_color2 Red
#property indicator_width1 8
#property indicator_width2 8
//---- buffers

double ExtMapBuffer1[];
double ExtMapBuffer2[];

int PipFactor = 1;
//+------------------------------------------------------------------+

//| Custom indicator initialization function |

//+------------------------------------------------------------------+

int init()

{

//---- indicators

SetIndexStyle(0,DRAW_HISTOGRAM);

SetIndexBuffer(0,ExtMapBuffer1);

SetIndexStyle(1,DRAW_HISTOGRAM);

SetIndexBuffer(1,ExtMapBuffer2);

string short_name = "Wick";

IndicatorShortName(short_name);
   IndicatorDigits(1);
   // Cater for fractional pips
   if (Digits == 3 || Digits == 5)
   {
      PipFactor = 10;
   }

//----

return(1);

}

//+------------------------------------------------------------------+

//| Custor indicator deinitialization function |

//+------------------------------------------------------------------+

int deinit()

{

//----

//----

return(0);

}

//+------------------------------------------------------------------+

//| Custom indicator iteration function |

//+------------------------------------------------------------------+

int start()

{

int counted_bars=IndicatorCounted();

//---- check for possible errors

if (counted_bars<0) return(-1);

//---- last counted bar will be recounted

if (counted_bars>0) counted_bars--;

int pos=Bars-counted_bars;


//---- main calculation loop
double dResult1;
double dResult2;
while(pos>=0)

{
if (iOpen(NULL, 0, pos) > iClose(NULL, 0, pos)){
   dResult1 = iHigh(NULL, 0, pos) - iOpen(NULL, 0, pos);
   }
if (iOpen(NULL, 0, pos) <= iClose(NULL, 0, pos)){
   dResult1 = iHigh(NULL, 0, pos) - iClose(NULL, 0, pos);
   }
if (iOpen(NULL, 0, pos) > iClose(NULL, 0, pos)){
   dResult2 = iLow(NULL, 0, pos) - iClose(NULL, 0, pos);
   }
if (iOpen(NULL, 0, pos) <= iClose(NULL, 0, pos)){
   dResult2 = iLow(NULL, 0, pos) - iOpen(NULL, 0, pos);
   }

ExtMapBuffer1[pos]= (dResult1/Point)/PipFactor ;
ExtMapBuffer2[pos]= (dResult2/Point)/PipFactor ;

pos--;

}

//----

return(0);

}

//+------------------------------------------------------------------+
Comments