WildersDMI_v1.1
Download script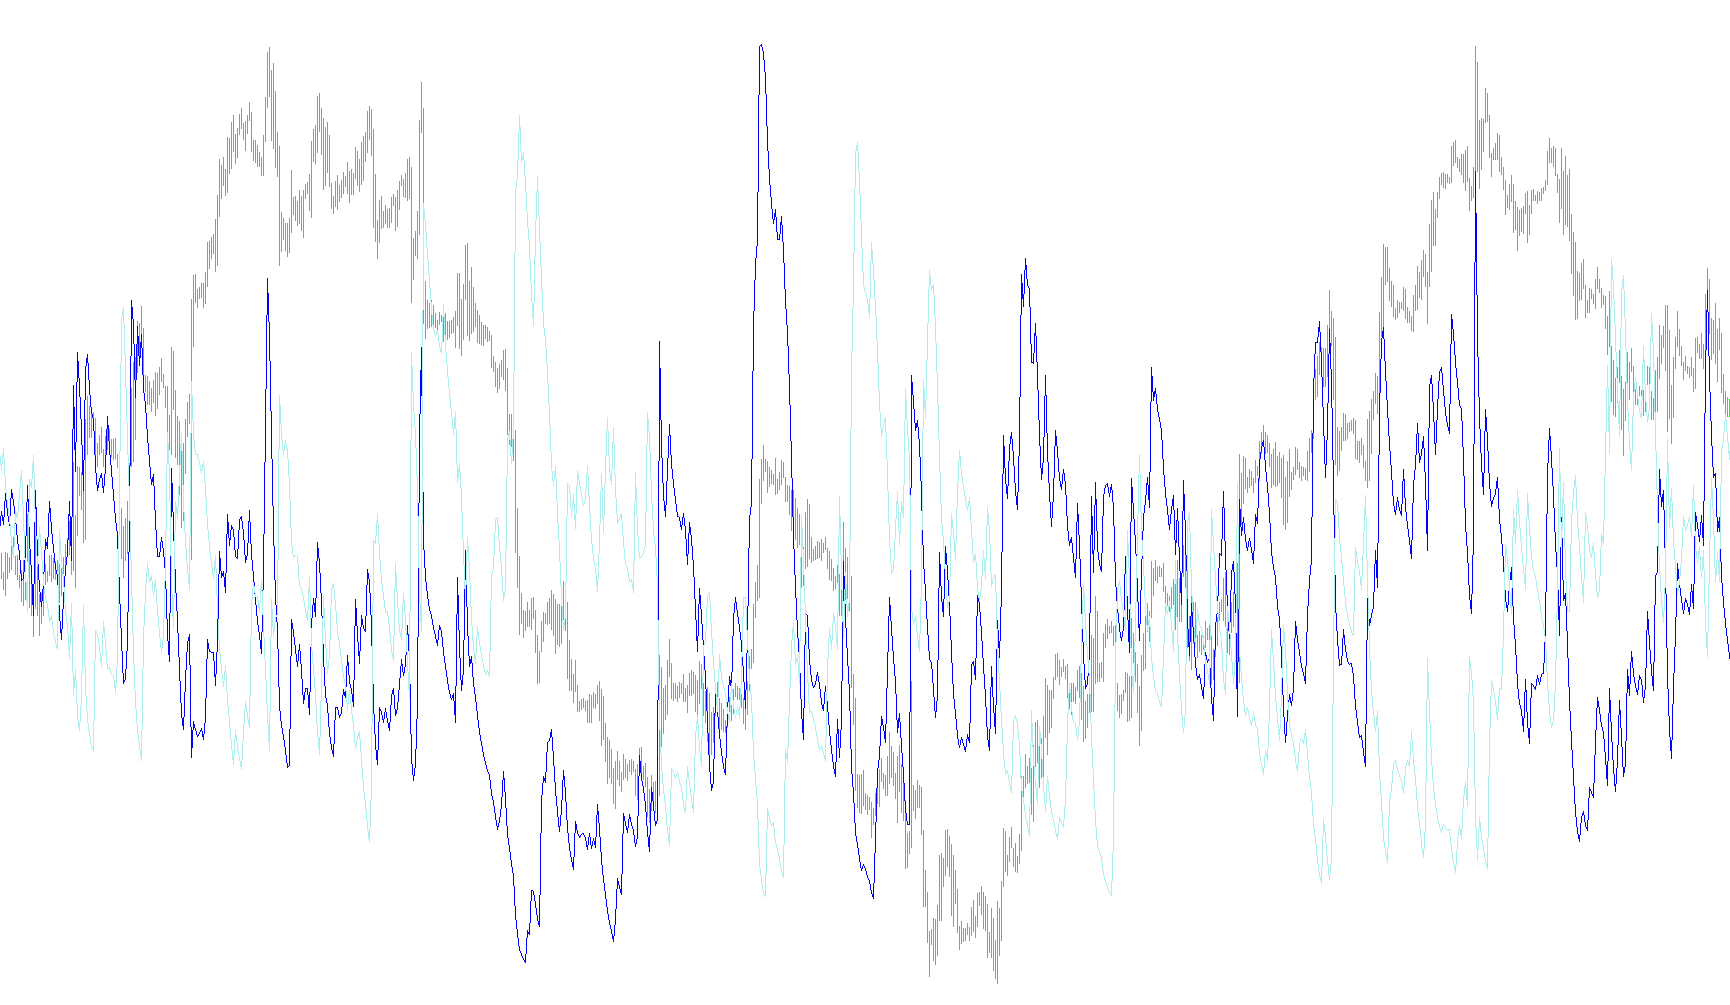
This script is designed as a technical analysis tool for trading platforms, specifically used to measure and visualize market trends. It functions by analyzing price movements to determine the strength and direction of a market's momentum, helping traders distinguish between trending markets and periods of consolidation.
Core Logic and Mechanics
The tool operates by processing historical price data—specifically High, Low, and Close prices—through several layers of mathematical filtering:
1. Movement Detection (Bullish vs. Bearish) The logic first identifies "Bullish" and "Bearish" pressure by comparing current price averages against previous ones.
- If the average high price increases, it calculates a bullish value.
- If the average low price decreases, it calculates a bearish value.
- The script ensures that these values are mutually exclusive; if one side is stronger than the other, the weaker side is neutralized to zero.
2. True Range and Smoothing To ensure the data isn't "noisy," the script calculates a "True Range" (the distance between the highest and lowest price points during a period). It then applies a specialized smoothing technique known as Wilder’s Smoothing. This method gives more weight to recent price action while maintaining a memory of previous trends, resulting in a much smoother and more reliable curve than standard moving averages.
3. Directional Indicators (+DI and -DI) From the smoothed bullish and bearish values, the script calculates two primary indicators:
- +DI (Positive Directional Indicator): Represents the strength of upward price movement.
- -DI (Negative Directional Indicator): Represents the strength of downward price movement. These are displayed as percentages, allowing traders to see which direction has the most dominance at any given moment.
4. Trend Strength (ADX and ADXR) Beyond just showing direction, the script can measure how strong that trend is:
- DX Calculation: The script calculates the difference between the positive and negative indicators.
- ADX (Average Directional Index): If enabled, the script smooths this difference to create the ADX line. A rising ADX suggests a strengthening trend (regardless of direction), while a falling ADX suggests a weakening trend or a sideways market.
- ADXR: If enabled, this provides a secondary smoothed average of the ADX, helping traders identify long-term structural shifts in momentum.
Summary for the User
In practical terms, this script helps you visualize three things simultaneously:
- Where is the price going? (The gap between +DI and -DI).
- How strong is that move? (The ADX value).
- Is the trend accelerating or fading? (The slope of the ADX and the smoothing of the indicators).
By using these combined metrics, the tool allows for a clearer understanding of market "health," helping to filter out minor price fluctuations and highlighting significant shifts in momentum.
//+------------------------------------------------------------------+
//|                                              WildersDMI_v1.1.mq4 |
//|                        Copyright © 2007-08, TrendLaboratory Ltd. |
//|            http://finance.groups.yahoo.com/group/TrendLaboratory |
//|                                       E-mail: igorad2004@list.ru |
//+------------------------------------------------------------------+
#property copyright "Copyright © 2007-08, TrendLaboratory Ltd."
#property link      "http://finance.groups.yahoo.com/group/TrendLaboratory"

#property indicator_separate_window
#property indicator_buffers   4
#property indicator_color1    LightBlue
#property indicator_width1    2
#property indicator_color2    Lime
#property indicator_width2    1
#property indicator_style2    2
#property indicator_color3    Tomato
#property indicator_width3    1
#property indicator_style3    2
#property indicator_color4    Orange
#property indicator_width4    2
#property indicator_level1    20
//---- input parameters
extern int       MA_Length    =  1; // Period of additional smoothing
extern int       DMI_Length   = 14; // Period of DMI
extern int       ADX_Length   = 14; // Period of ADX
extern int       ADXR_Length  = 14; // Period of ADXR
extern int       UseADX       =  0; // Use ADX: 0-off,1-on
extern int       UseADXR      =  0; // Use ADXR: 0-off,1-on
//---- buffers
double ADX[];
double PDI[];
double MDI[];
double ADXR[];
double sPDI[];
double sMDI[];
double STR[];
double DX[];

int len;
//+------------------------------------------------------------------+
//| Custom indicator initialization function                         |
//+------------------------------------------------------------------+
int init()
{
//---- indicators
   IndicatorBuffers(8);
   SetIndexStyle(0,DRAW_LINE);
   SetIndexBuffer(0,ADX);
   SetIndexStyle(1,DRAW_LINE);
   SetIndexBuffer(1,PDI);
   SetIndexStyle(2,DRAW_LINE);
   SetIndexBuffer(2,MDI);
   SetIndexStyle(3,DRAW_LINE);
   SetIndexBuffer(3,ADXR);
   SetIndexBuffer(4,sPDI);
   SetIndexBuffer(5,sMDI);
   SetIndexBuffer(6,STR);
   SetIndexBuffer(7,DX);
   //---- name for DataWindow and indicator subwindow label
   string short_name="WildersDMI_v1.1("+MA_Length+","+DMI_Length+","+ADX_Length+","+ADXR_Length+")";
   IndicatorShortName(short_name);
   SetIndexLabel(0,"ADX");
   SetIndexLabel(1,"+DI");
   SetIndexLabel(2,"-DI");
   SetIndexLabel(3,"ADXR");
//----
   len = DMI_Length + MA_Length + 1;
   SetIndexDrawBegin(0,len);
   SetIndexDrawBegin(1,len);
   SetIndexDrawBegin(2,len);
   SetIndexDrawBegin(3,len);

   return(0);
}

//+------------------------------------------------------------------+
//| Custom indicator iteration function                              |
//+------------------------------------------------------------------+
int start()
{
   int    i,shift,limit,counted_bars=IndicatorCounted();
   double alfa1 = 1.0/DMI_Length;
   double alfa2 = 1.0/ADX_Length;
   double Bulls, Bears, TR = 0;
//----
   if (counted_bars < 0) return(-1);

   if(counted_bars<1)
      for(i=1;i<=MA_Length;i++)
      {
      PDI[Bars-i]=0.0;
      MDI[Bars-i]=0.0;
      ADX[Bars-i]=0.0;
      sPDI[Bars-i]=0.0;
      sMDI[Bars-i]=0.0;
      DX[Bars-i]=0.0;
      STR[Bars-i]=0.0;
      ADXR[Bars-i]=0.0;
      }

   if(counted_bars>0) counted_bars--;
   limit=Bars-counted_bars;

   for(shift=limit;shift>=0;shift--)
   {
   double AvgHigh  = iMA(NULL,0,MA_Length,0,1,PRICE_HIGH,shift);
   double AvgHigh1 = iMA(NULL,0,MA_Length,0,1,PRICE_HIGH,shift+1);
   double AvgLow   = iMA(NULL,0,MA_Length,0,1,PRICE_LOW,shift);
   double AvgLow1  = iMA(NULL,0,MA_Length,0,1,PRICE_LOW,shift+1);
   double AvgClose1= iMA(NULL,0,MA_Length,0,1,PRICE_CLOSE,shift+1);

   if (AvgHigh >= AvgHigh1) Bulls = 0.5*(MathAbs(AvgHigh-AvgHigh1)+(AvgHigh-AvgHigh1));
   else Bulls = 0;
   if (AvgLow  <= AvgLow1 ) Bears = 0.5*(MathAbs(AvgLow1-AvgLow)+(AvgLow1-AvgLow));
   else Bears = 0;

   if (Bulls > Bears) Bears = 0;
   else
   if (Bulls < Bears) Bulls = 0;
   else
   if (Bulls == Bears) {Bulls = 0;Bears = 0;}

   TR = MathMax(AvgHigh-AvgLow,AvgHigh-AvgClose1);
   TR = MathMax(TR,AvgClose1 - AvgLow);

      if(shift <= Bars - MA_Length - 1 && shift >= Bars - len - 1)
      {
      sPDI[shift] += Bulls;
      sMDI[shift] += Bears;
      STR[shift]  += TR;
         if(shift == Bars - len - 1)
         {
         sPDI[shift] = Bulls/DMI_Length;
         sMDI[shift] = Bears/DMI_Length;
         STR[shift]  = TR/DMI_Length;
         }
      }
      else
      if(shift < Bars - len - 1)
      {
      sPDI[shift] = sPDI[shift+1] + alfa1 * (Bulls - sPDI[shift+1]);
      sMDI[shift] = sMDI[shift+1] + alfa1 * (Bears - sMDI[shift+1]);
      STR[shift]  = STR[shift+1]  + alfa1 * (TR - STR[shift+1]);

         if(STR[shift] != 0)
         {
         PDI[shift] = 100*sPDI[shift]/STR[shift];
         MDI[shift] = 100*sMDI[shift]/STR[shift];
         }
         else
         {
         PDI[shift] = 0;
         MDI[shift] = 0;
         }

         if(UseADX > 0)
         {
         if((PDI[shift] + MDI[shift]) != 0)
         DX[shift] = 100*MathAbs(PDI[shift] - MDI[shift])/(PDI[shift] + MDI[shift]);
         else DX[shift] = 0;

         ADX[shift] = ADX[shift+1] + alfa2 * (DX[shift] - ADX[shift+1]);

         if(UseADXR >0) ADXR[shift] = 0.5*(ADX[shift] + ADX[shift+ADXR_Length]);
         }
      }
   }

//----
   return(0);
}
//+------------------------------------------------------------------+
Comments