YANS_IND2_01_v1
Download script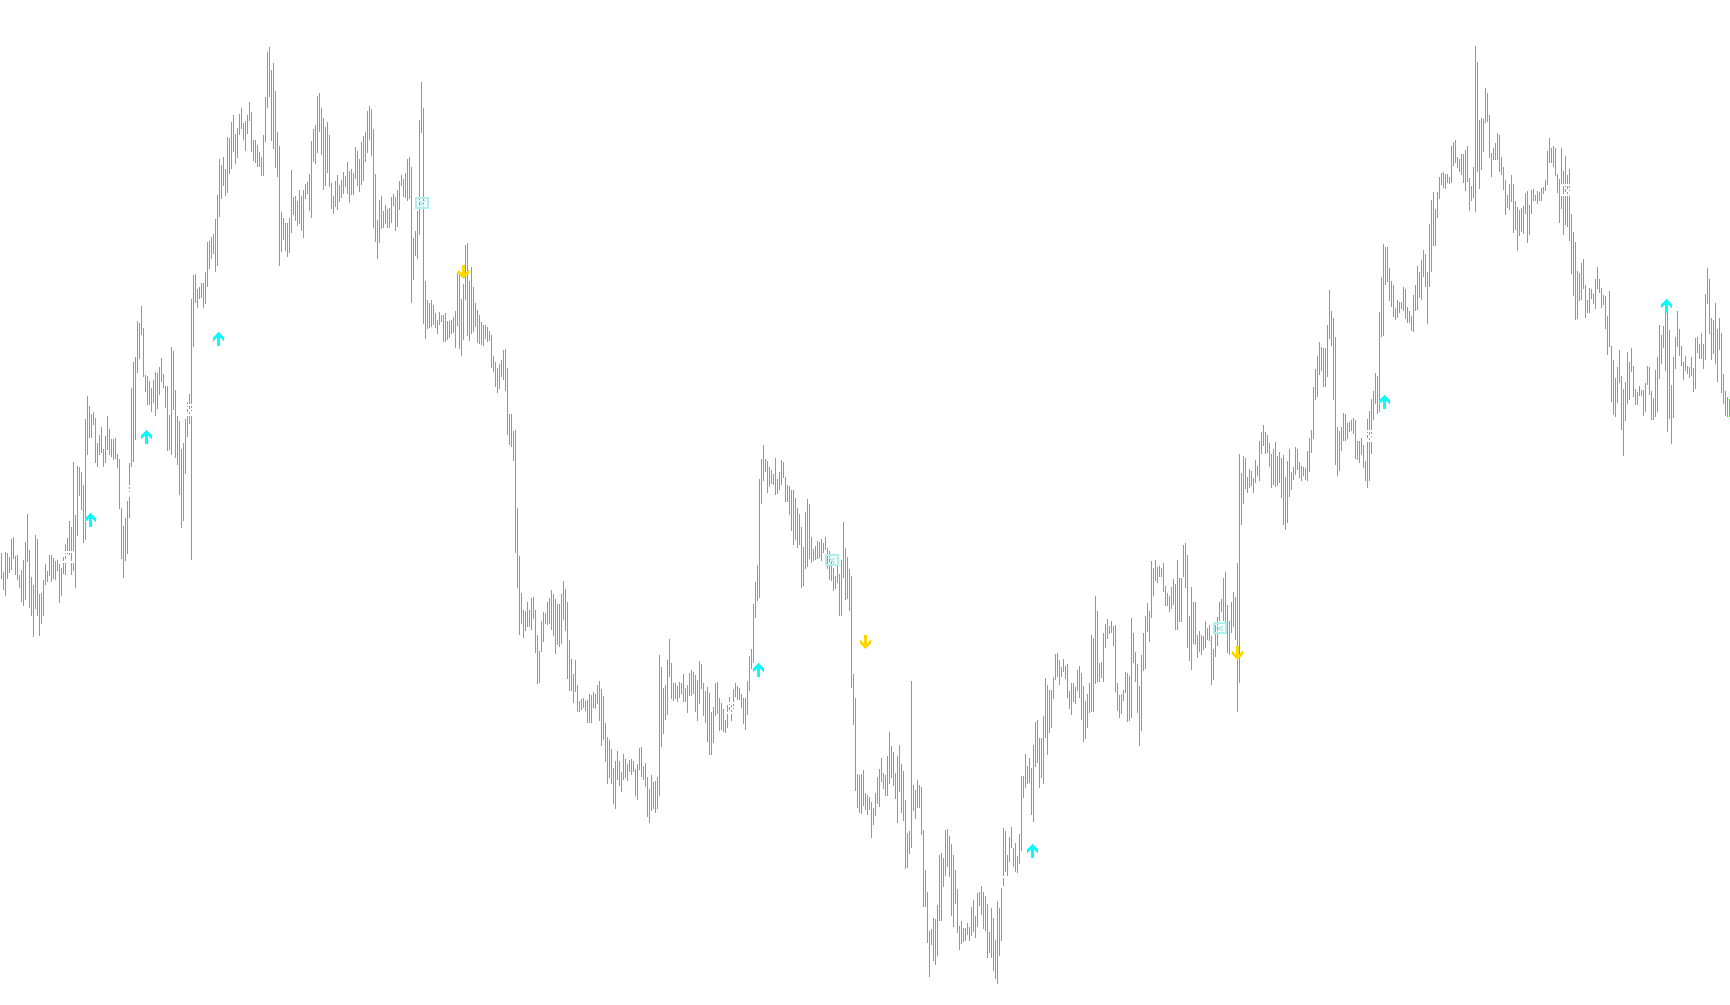
This technical tool is designed to assist traders by identifying potential trend reversals and momentum shifts on a price chart. It achieves this by analyzing the relationship between three primary market indicators: two Exponential Moving Averages (EMAs) of different lengths (10 and 40 periods) and a Parabolic SAR (Stop and Reverse) indicator.
Core Logic Overview
The script monitors the interaction between these indicators to filter out "noise" and highlight significant price action. Instead of simply showing every signal, it uses a multi-layered logic gate to ensure that signals are only displayed when specific conditions are met simultaneously.
Key Functional Components
1. Moving Average Crossovers The tool tracks when the short-term moving average (10) crosses over or under the long-term moving average (40). These crossovers typically indicate a change in trend direction. However, the script treats these as "base signals" rather than immediate actions; it identifies the exact point where the trend shifts but waits for additional confirmation from other indicators.
2. Parabolic SAR Filtering The Parabolic SAR is used as a dynamic confirmation tool. The logic checks the position of the SAR relative to the price and the Moving Averages.
- It looks for instances where the SAR crosses the long-term EMA (the 40-period line).
- It specifically monitors whether the SAR is "flipping" (moving from above to below or vice versa) in relation to the high and low prices of the candles.
3. Confirmation & Timing Logic To prevent false signals, the script employs a "waiting period" mechanism:
- Distance Check: The tool tracks how many periods have passed since the last Moving Average crossover. It requires a minimum distance (at least 6 periods) to be met before it validates a signal. This ensures that the market has established enough momentum in the new direction.
- One-Time Signal Validation: Once a valid confirmation occurs—where the SAR crosses the EMA following a trend shift—the script marks that specific point as a confirmed signal and then "locks" it to prevent duplicate icons from appearing on the same move.
Visual Output Logic
The script communicates these findings using a series of visual markers on the chart:
- Trend Shift Markers: When the 10-period EMA crosses the 40-period EMA, the tool prepares to place a marker (an "Open Box" or "X Box") at the crossover point.
- Confirmation Arrows: If the SAR confirms the trend shift after the required time threshold is met, the script places specific arrows (Red for downward trends, White for upward trends) on the chart.
- Dynamic Cleanup: The logic includes a mechanism to reset or clear markers if the conditions are not finalized, ensuring that only high-probability signals remain visible to the user.
In summary, this script functions as a sophisticated filter. It identifies where a trend is changing (Moving Averages), confirms that the change has enough strength to be valid (Distance Check), and verifies that the momentum aligns with price action (Parabolic SAR).
//+------------------------------------------------------------------+
//|                                                                  |
//+------------------------------------------------------------------+
#property copyright "Ron T"
#property link      "http://www.lightpatch.com"

#property indicator_chart_window
#property indicator_buffers 8

#property indicator_color1 Red
#property indicator_color2 Red
#property indicator_color3 Red
#property indicator_color4 Red

#property indicator_color5 White
#property indicator_color6 White
#property indicator_color7 White
#property indicator_color8 White


//---- buffers
double Buffer1[];
double Buffer2[];
double Buffer3[];
double Buffer4[];
double Buffer5[];
double Buffer6[];
double Buffer7[];
double Buffer8[];


// User Input


//+------------------------------------------------------------------+
//| Custom indicator initialization function                         |
//|------------------------------------------------------------------|

int init()
  {

   // 233 up arrow
   // 234 down arrow
   // 159 big dot
   // 168 open square
   // 120 box with X

   SetIndexStyle(0,DRAW_ARROW);  //RED ARROW
   SetIndexBuffer(0, Buffer1);
   SetIndexArrow(0,234);

   SetIndexStyle(1,DRAW_ARROW);
   SetIndexBuffer(1, Buffer2);
   SetIndexArrow(1,159);

   SetIndexStyle(2,DRAW_ARROW);  //RED OPEN BOX
   SetIndexBuffer(2, Buffer3);
   SetIndexArrow(2,120);

   SetIndexStyle(3,DRAW_ARROW);  //RED DOT
   SetIndexBuffer(3, Buffer4);
   SetIndexArrow(3,159);

   SetIndexStyle(4,DRAW_ARROW);  //WHITE ARROW
   SetIndexBuffer(4, Buffer5);
   SetIndexArrow(4,233);

   SetIndexStyle(5,DRAW_ARROW);
   SetIndexBuffer(5, Buffer6);
   SetIndexArrow(5,159);

   SetIndexStyle(6,DRAW_ARROW);  //WHITE X BOX
   SetIndexBuffer(6, Buffer7);
   SetIndexArrow(6,120);

   SetIndexStyle(7,DRAW_ARROW);  //RED DOT
   SetIndexBuffer(7, Buffer8);
   SetIndexArrow(7,159);

   return(0);
  }


//+------------------------------------------------------------------+
//| Custor indicator deinitialization function                       |
//+------------------------------------------------------------------+
int deinit()
  {
   int i;

   for( i=0; i<Bars; i++ ) Buffer1[i]=0;
   for( i=0; i<Bars; i++ ) Buffer2[i]=0;
   for( i=0; i<Bars; i++ ) Buffer3[i]=0;
   for( i=0; i<Bars; i++ ) Buffer4[i]=0;
   for( i=0; i<Bars; i++ ) Buffer5[i]=0;
   for( i=0; i<Bars; i++ ) Buffer6[i]=0;
   for( i=0; i<Bars; i++ ) Buffer7[i]=0;
   for( i=0; i<Bars; i++ ) Buffer8[i]=0;

   return(0);
  }


//+------------------------------------------------------------------+
//| Custom indicator iteration function                              |
//+------------------------------------------------------------------+
int start()
  {
   int      pos=Bars-100; // leave room for moving average periods

   double   cEMA10=0, pEMA10=0;
   double   cEMA40=0, pEMA40=0;
   double   cSAR=0,   pSAR=10;

   int      lastcross=0;
   double   lastlevel=0;

   bool      rising=false;
   bool     falling=false;

   bool       sarLO=false;
   bool       sarHI=false;

   bool      flipUP=false;
   bool      flipDN=false;


   int      dCROSS;    // how many periods since last MA cross

   int      above=0;   // how long SAR has been up
   int      below=0;   // how long SAR has been down

   double    p=Point();

   bool      Over=false;
   bool      Under=false;

   bool      onecross=false;


   // 1 RED    DOWN ARROW
   // 2 RED
   // 3 RED    BIG OPEN BOX
   // 4 RED    BIG DOT
   // 5 WHITE  UP ARROW
   // 6 WHITE
   // 7 WHITE  BIG X BOX
   // 8 WHITE  BIG DOT

   while(pos>=0)
     {

      cEMA10=iMA(Symbol(),0,10,0,MODE_EMA,PRICE_CLOSE, pos);
      pEMA10=iMA(Symbol(),0,10,0,MODE_EMA,PRICE_CLOSE, pos+1);
      cEMA40=iMA(Symbol(),0,40,0,MODE_EMA,PRICE_CLOSE, pos);
      pEMA40=iMA(Symbol(),0,40,0,MODE_EMA,PRICE_CLOSE, pos+1);
      cSAR=iSAR(Symbol(),0,0.02,0.2,pos);
      pSAR=iSAR(Symbol(),0,0.02,0.2,pos+1);

      //
      // Set all the switches
      //

      // determine if rising or falling cross
      rising=false;
      if (pEMA10<=pEMA40 && cEMA10>=cEMA40){rising=true; onecross=false;}
      falling=false;
      if (pEMA10>=pEMA40 && cEMA10<=cEMA40){falling=true; onecross=false;}

      // which side is SAR on
      sarLO=false;
      if (cSAR<Low[pos])  sarLO=true;
      sarHI=false;
      if (cSAR>High[pos]) sarHI=true;

      // did PSAR just flip
      flipUP=false;
      if (pSAR<=Low[pos+1] && cSAR>=High[pos]){flipUP=true;}
      flipDN=false;
      if (pSAR>=High[pos+1] && cSAR<=Low[pos]){flipDN=true;}


      //
      // Show all the indicators based on switches
      //

      // rising crosses with LOW SAR ONLY
      //Buffer7[pos]=cEMA10;
      if (rising){lastcross=pos; lastlevel=cEMA10; above=0; below=0; dCROSS=0;}  //WHITE BOX
      // falling crosses with HIGH SAR ONLY
      //Buffer3[pos]=cEMA10;
      if (falling){lastcross=pos; lastlevel=cEMA10; above=0; below=0; dCROSS=0;} //RED BOX

      //SAR crossed above EMA40
      if (pSAR<pEMA40 && cSAR>=cEMA40 && !flipUP && !flipDN)
         {
          if (!onecross && dCROSS>=6) {Buffer7[lastcross]=lastlevel; Buffer5[pos]=cSAR; onecross=true;}
         }
      //SAR crossed below EMA40
      if (pSAR>pEMA40 && cSAR<=cEMA40 && !flipUP && !flipDN)
         {
          if (!onecross && dCROSS>=6) {Buffer3[lastcross]=lastlevel; Buffer1[pos]=cSAR; onecross=true;}
         }

      if  (rising && !onecross) {Buffer7[lastcross]=0; lastcross=pos;}
      if (falling && !onecross) {Buffer3[lastcross]=0; lastcross=pos;}


      //if (sarHI) above++;  // count how long SAR has been up
      //if (sarLO) below++;  // count how long SAR has been down

      //if (flipUP && below<=6){Buffer1[pos]=cSAR;}
      //if (flipDN && above<=6){Buffer5[pos]=cSAR;}


      dCROSS++;
 	   pos--;
     }

   return(0);
  }
//+------------------------------------------------------------------+
Comments