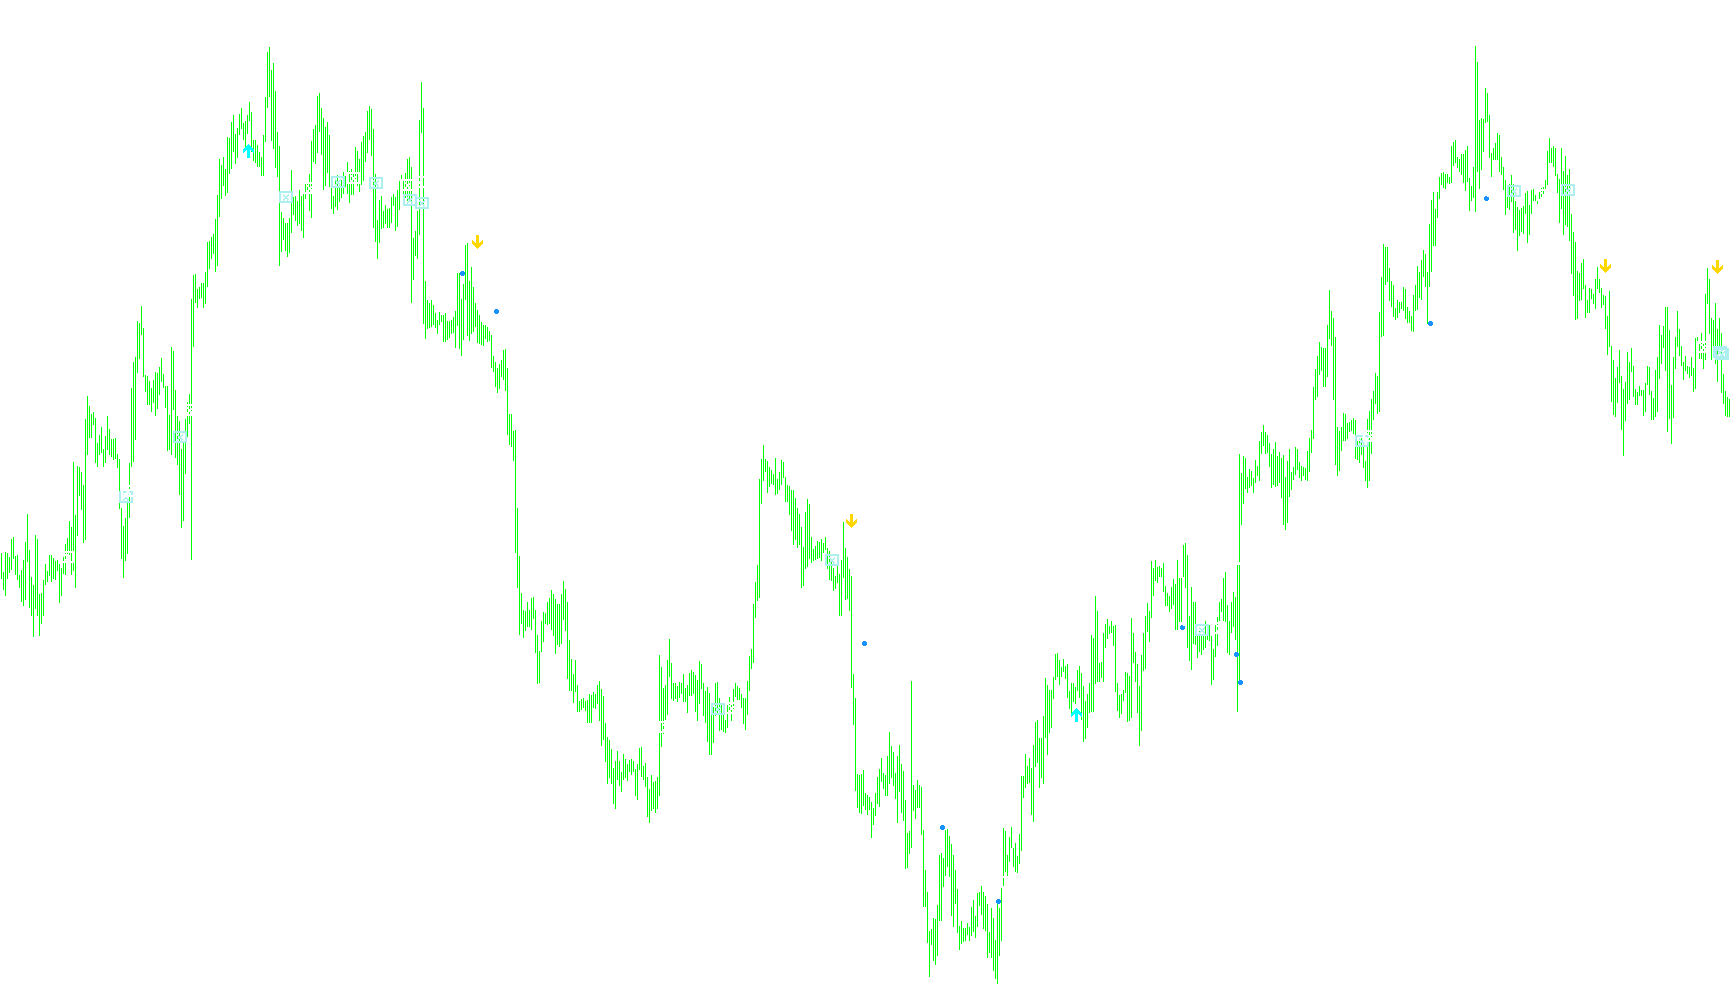
This script is a technical analysis tool designed for the MetaTrader platform to identify specific market trend shifts and momentum changes. Rather than showing a simple line, it acts as an automated signaling system that scans historical price data to place visual markers (arrows, dots, and boxes) on your chart.
The logic behind these signals is built on the interaction between three primary technical components: Exponential Moving Averages (EMA), the Parabolic SAR (Stop and Reverse), and price action relative to these averages.
Core Logic Components
1. Trend Detection via Moving Averages The script constantly monitors two different timeframes of moving averages: a fast 10-period EMA and a slower 40-period EMA. It looks for "crosses"—moments where the fast average moves from below to above (bullish) or above to below (bearish) the slow average. These crosses represent shifts in medium-term momentum.
2. Trend Filtering via Parabolic SAR To ensure the signals are high-quality, the script uses the Parabolic SAR as a filter. The SAR is a volatility-based indicator that sits above or below the price to suggest potential trend reversals. The script tracks whether the SAR is currently "high" (above the price) or "low" (below the price) and counts how long it has remained in that position.
3. Signal Validation Rules The most important part of this script's logic is that it does not provide a signal every time a moving average crosses. It requires specific conditions to be met simultaneously:
- Momentum Confirmations (Boxes): The script places a "Box" marker when the Moving Averages cross, but only if the Parabolic SAR is already aligned with that direction. For example, a bullish cross is only highlighted if the SAR confirms low-side support.
- Stability Check: The script includes a "cooldown" or stability check. It tracks how long the SAR has been in its current position. If the SAR has been stable for more than 6 periods, it triggers specific "Dot" markers to signal that the Parabolic SAR has crossed the 40-period Moving Average, marking a significant trend transition.
- Reversal Alerts (Arrows): The most aggressive signals are the arrows. These appear when the Parabolic SAR makes a sharp "flip"—meaning it jumps from one side of the price to the other very quickly. However, even these alerts are filtered: they only appear if the move happens relatively early in the trend (within 6 periods of the flip), helping traders identify fresh reversals rather than exhausted moves.
Summary for the User
In plain terms, this script filters out "noise" by requiring multiple types of mathematical confirmation before it draws anything on your chart. It identifies:
- Trend Starts: When moving averages cross and SAR agrees.
- Major Shifts: When the SAR crosses a major moving average after a period of stability.
- Early Reversals: When the SAR flips direction rapidly in the early stages of a new move.
//+------------------------------------------------------------------+
//| 5 Min RSI 12-period qual INDICATOR                               |
//+------------------------------------------------------------------+
#property copyright "Ron T"
#property link      "http://www.lightpatch.com"

#property indicator_chart_window
#property indicator_buffers 8

#property indicator_color1 Red
#property indicator_color2 Red
#property indicator_color3 Red
#property indicator_color4 Red

#property indicator_color5 White
#property indicator_color6 White
#property indicator_color7 White
#property indicator_color8 White


//---- buffers
double Buffer1[];
double Buffer2[];
double Buffer3[];
double Buffer4[];
double Buffer5[];
double Buffer6[];
double Buffer7[];
double Buffer8[];


// User Input


//+------------------------------------------------------------------+
//| Custom indicator initialization function                         |
//|------------------------------------------------------------------|

int init()
  {

   // 233 up arrow
   // 234 down arrow
   // 159 big dot
   // 168 open square
   // 120 box with X

   SetIndexStyle(0,DRAW_ARROW);  //RED ARROW
   SetIndexBuffer(0, Buffer1);
   SetIndexArrow(0,234);

   SetIndexStyle(1,DRAW_ARROW);
   SetIndexBuffer(1, Buffer2);
   SetIndexArrow(1,159);

   SetIndexStyle(2,DRAW_ARROW);  //RED OPEN BOX
   SetIndexBuffer(2, Buffer3);
   SetIndexArrow(2,120);

   SetIndexStyle(3,DRAW_ARROW);  //RED DOT
   SetIndexBuffer(3, Buffer4);
   SetIndexArrow(3,159);


   SetIndexStyle(4,DRAW_ARROW);  //WHITE ARROW
   SetIndexBuffer(4, Buffer5);
   SetIndexArrow(4,233);

   SetIndexStyle(5,DRAW_ARROW);
   SetIndexBuffer(5, Buffer6);
   SetIndexArrow(5,159);

   SetIndexStyle(6,DRAW_ARROW);  //WHITE X BOX
   SetIndexBuffer(6, Buffer7);
   SetIndexArrow(6,120);

   SetIndexStyle(7,DRAW_ARROW);  //RED DOT
   SetIndexBuffer(7, Buffer8);
   SetIndexArrow(7,159);

   return(0);
  }


//+------------------------------------------------------------------+
//| Custor indicator deinitialization function                       |
//+------------------------------------------------------------------+
int deinit()
  {
   int i;

   for( i=0; i<Bars; i++ ) Buffer1[i]=0;
   for( i=0; i<Bars; i++ ) Buffer2[i]=0;
   for( i=0; i<Bars; i++ ) Buffer3[i]=0;
   for( i=0; i<Bars; i++ ) Buffer4[i]=0;
   for( i=0; i<Bars; i++ ) Buffer5[i]=0;
   for( i=0; i<Bars; i++ ) Buffer6[i]=0;
   for( i=0; i<Bars; i++ ) Buffer7[i]=0;
   for( i=0; i<Bars; i++ ) Buffer8[i]=0;

   return(0);
  }


//+------------------------------------------------------------------+
//| Custom indicator iteration function                              |
//+------------------------------------------------------------------+
int start()
  {
   int      pos=Bars-150; // leave room for moving average periods

   double   cEMA10=0, pEMA10=0;
   double   cEMA40=0, pEMA40=0;
   double   cSAR=0,   pSAR=10;

   bool      rising=false;
   bool     falling=false;

   bool       sarLO=false;
   bool       sarHI=false;

   bool      flipUP=false;
   bool      flipDN=false;


   int      dCROSS;    // how many periods since last MA cross

   int      above=0;   // how long SAR has been up
   int      below=0;   // how long SAR has been down

   double    p=Point();

   bool      Over=false;
   bool      Under=false;


   // 1 RED    DOWN ARROW
   // 2 RED
   // 3 RED    BIG OPEN BOX
   // 4 RED    BIG DOT
   // 5 WHITE  UP ARROW
   // 6 WHITE
   // 7 WHITE  BIG X BOX
   // 8 WHITE  BIG DOT

   while(pos>=0)
     {

      cEMA10=iMA(Symbol(),0,10,0,MODE_EMA,PRICE_CLOSE, pos);
      pEMA10=iMA(Symbol(),0,10,0,MODE_EMA,PRICE_CLOSE, pos+1);
      cEMA40=iMA(Symbol(),0,40,0,MODE_EMA,PRICE_CLOSE, pos);
      pEMA40=iMA(Symbol(),0,40,0,MODE_EMA,PRICE_CLOSE, pos+1);
      cSAR=iSAR(Symbol(),0,0.02,0.2,pos);
      pSAR=iSAR(Symbol(),0,0.02,0.2,pos+1);

      //
      // Set all the switches
      //

      // determine if rising or falling cross
      rising=false;
      if (pEMA10<=pEMA40 && cEMA10>=cEMA40){rising=true;}
      falling=false;
      if (pEMA10>=pEMA40 && cEMA10<=cEMA40){falling=true;}

      // which side is SAR on
      sarLO=false;
      if (cSAR<Low[pos])  sarLO=true;
      sarHI=false;
      if (cSAR>High[pos]) sarHI=true;

      // did PSAR just flip
      flipUP=false;
      if (pSAR<=Low[pos+1] && cSAR>=High[pos]){flipUP=true;}
      flipDN=false;
      if (pSAR>=High[pos+1] && cSAR<=Low[pos]){flipDN=true;}


      //
      // Show all the indicators based on switches
      //

      // rising crosses with LOW SAR ONLY
      if (rising){Buffer7[pos]=cEMA10; above=0; below=0;}  //WHITE BOX
      // falling crosses with HIGH SAR ONLY
      if (falling){Buffer3[pos]=cEMA10; above=0; below=0;} //RED BOX

      if (sarHI) above++;  // count how long SAR has been up
      if (sarLO) below++;  // count how long SAR has been down

      if (above+below>6)
        {
         //SAR crossed above EMA40
         if (pSAR<pEMA40 && cSAR>=cEMA40 && !flipUP && !flipDN){Buffer8[pos]=cSAR;} // dot
         //SAR crossed below EMA40
         if (pSAR>pEMA40 && cSAR<=cEMA40 && !flipUP && !flipDN){Buffer4[pos]=cSAR;} // dot

         if (flipUP && below<=6){Buffer1[pos]=cSAR;}  // arrow
         if (flipDN && above<=6){Buffer5[pos]=cSAR;}  // arrow
        }


 	   pos--;
     }

   return(0);
  }
//+------------------------------------------------------------------+
Comments