RD-Combo
Indicator

RD-Combo

iCCIiADXiMAiRVI

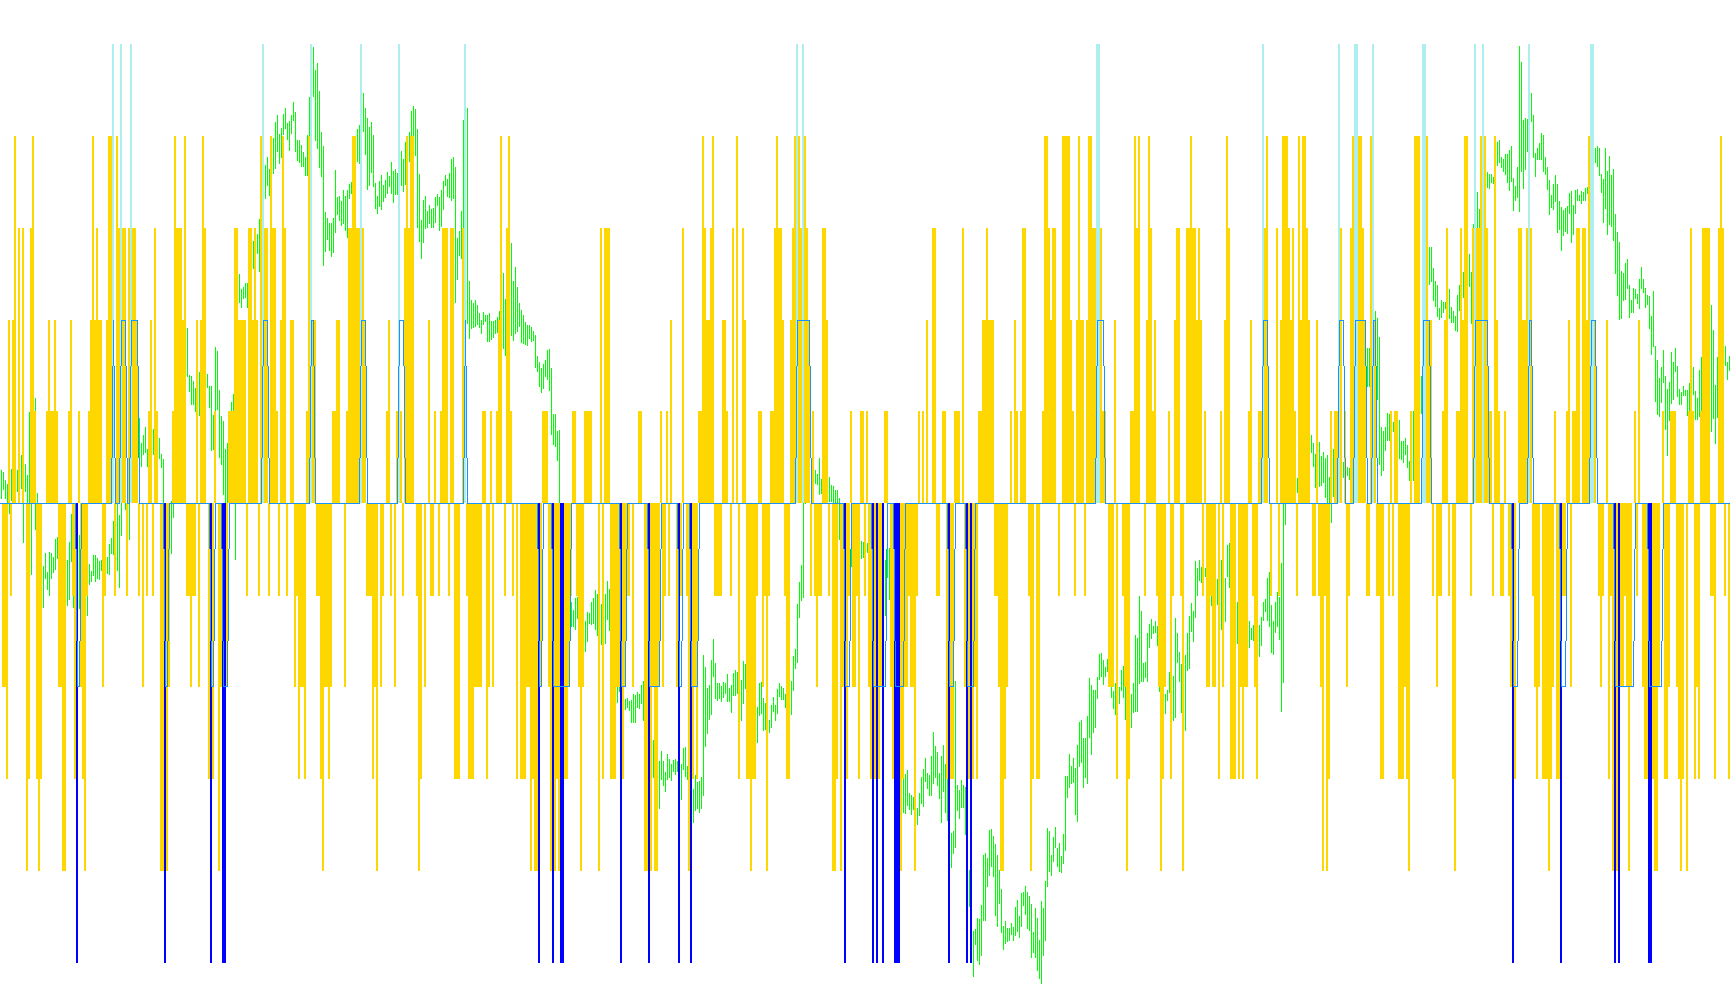
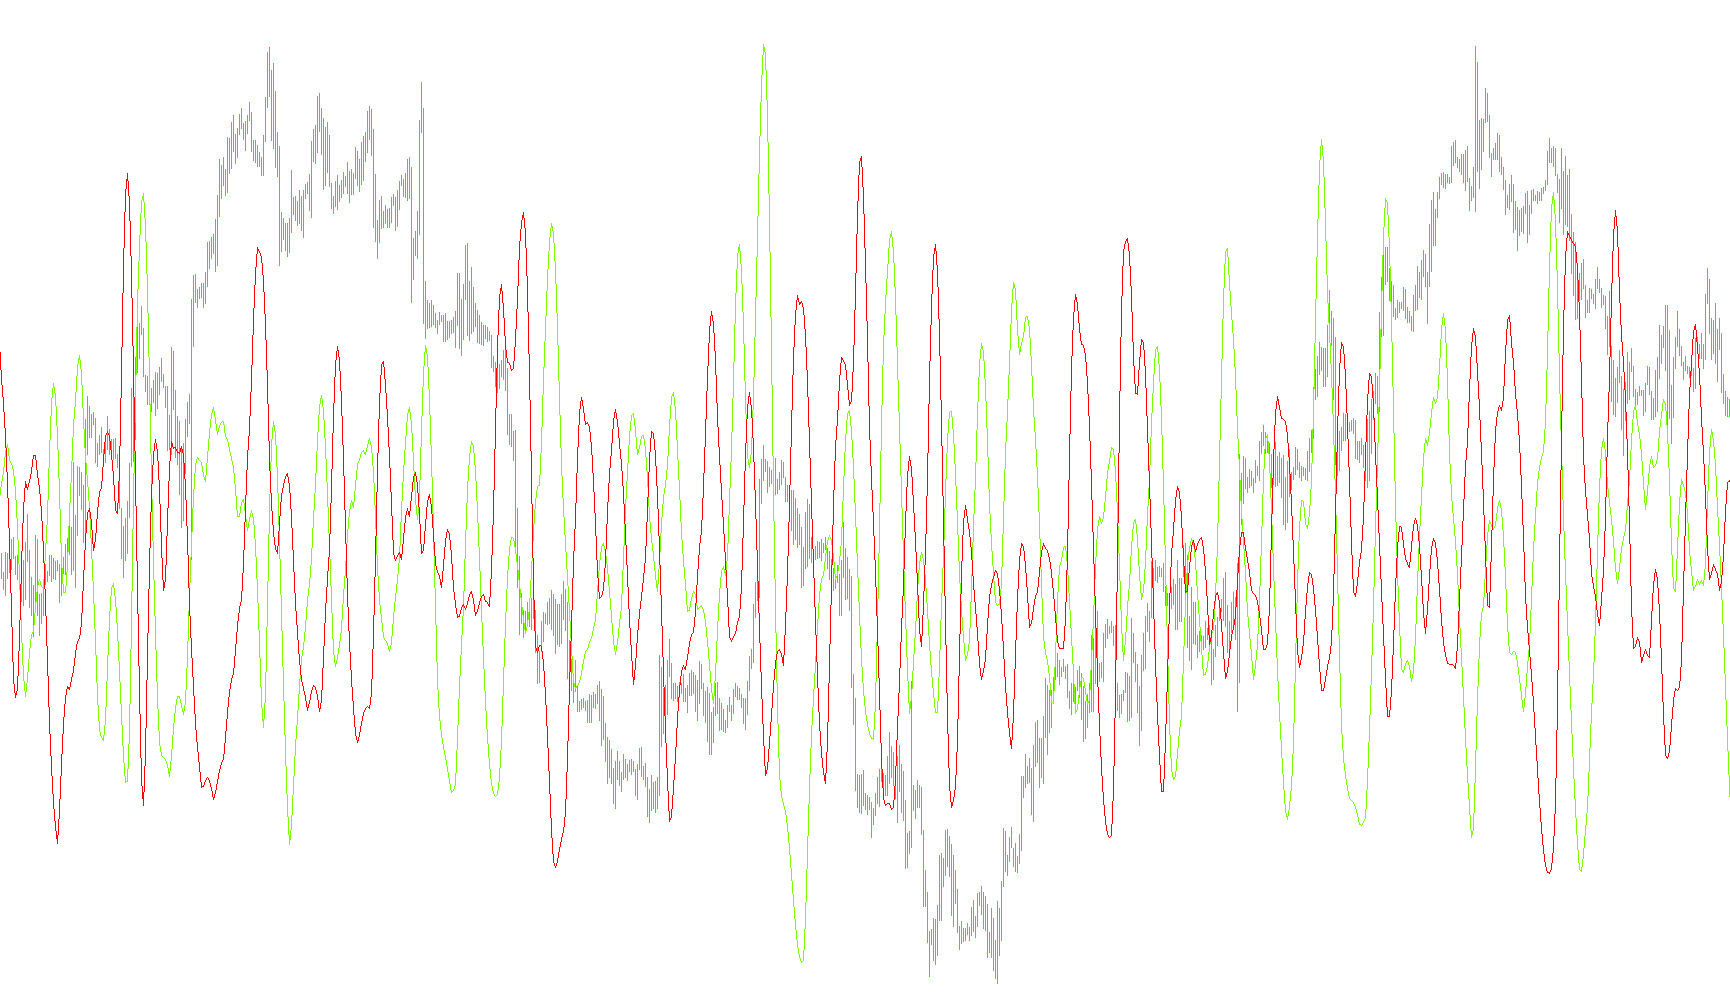
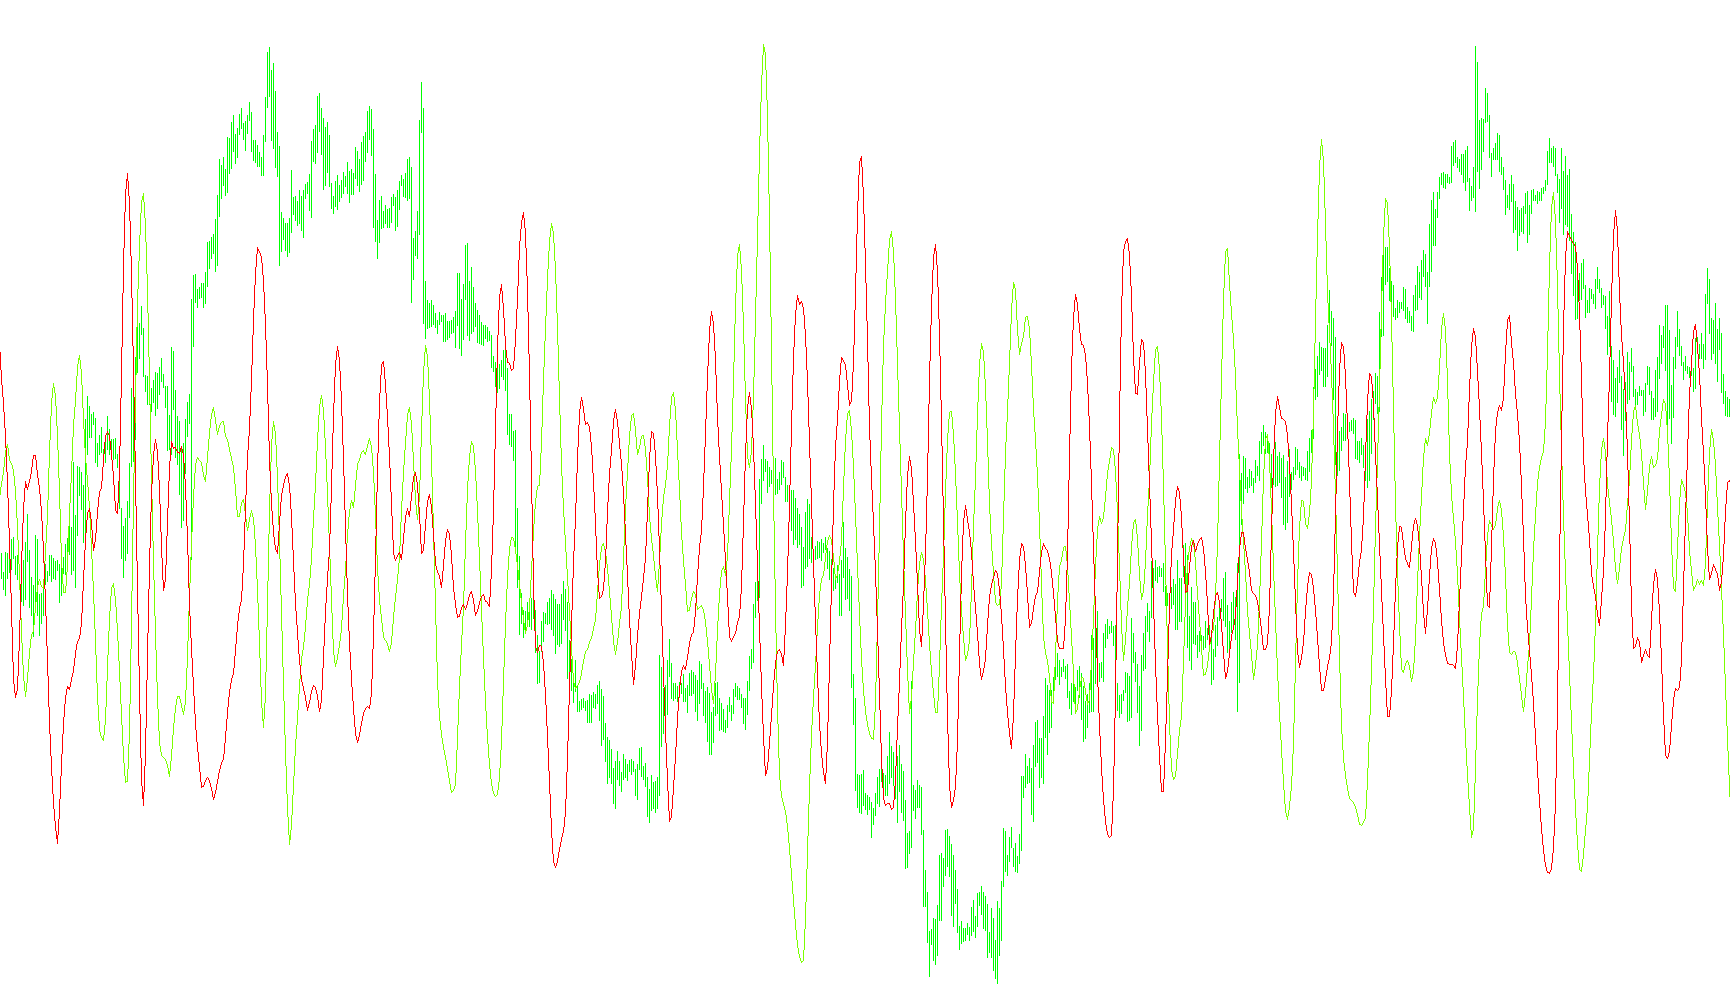
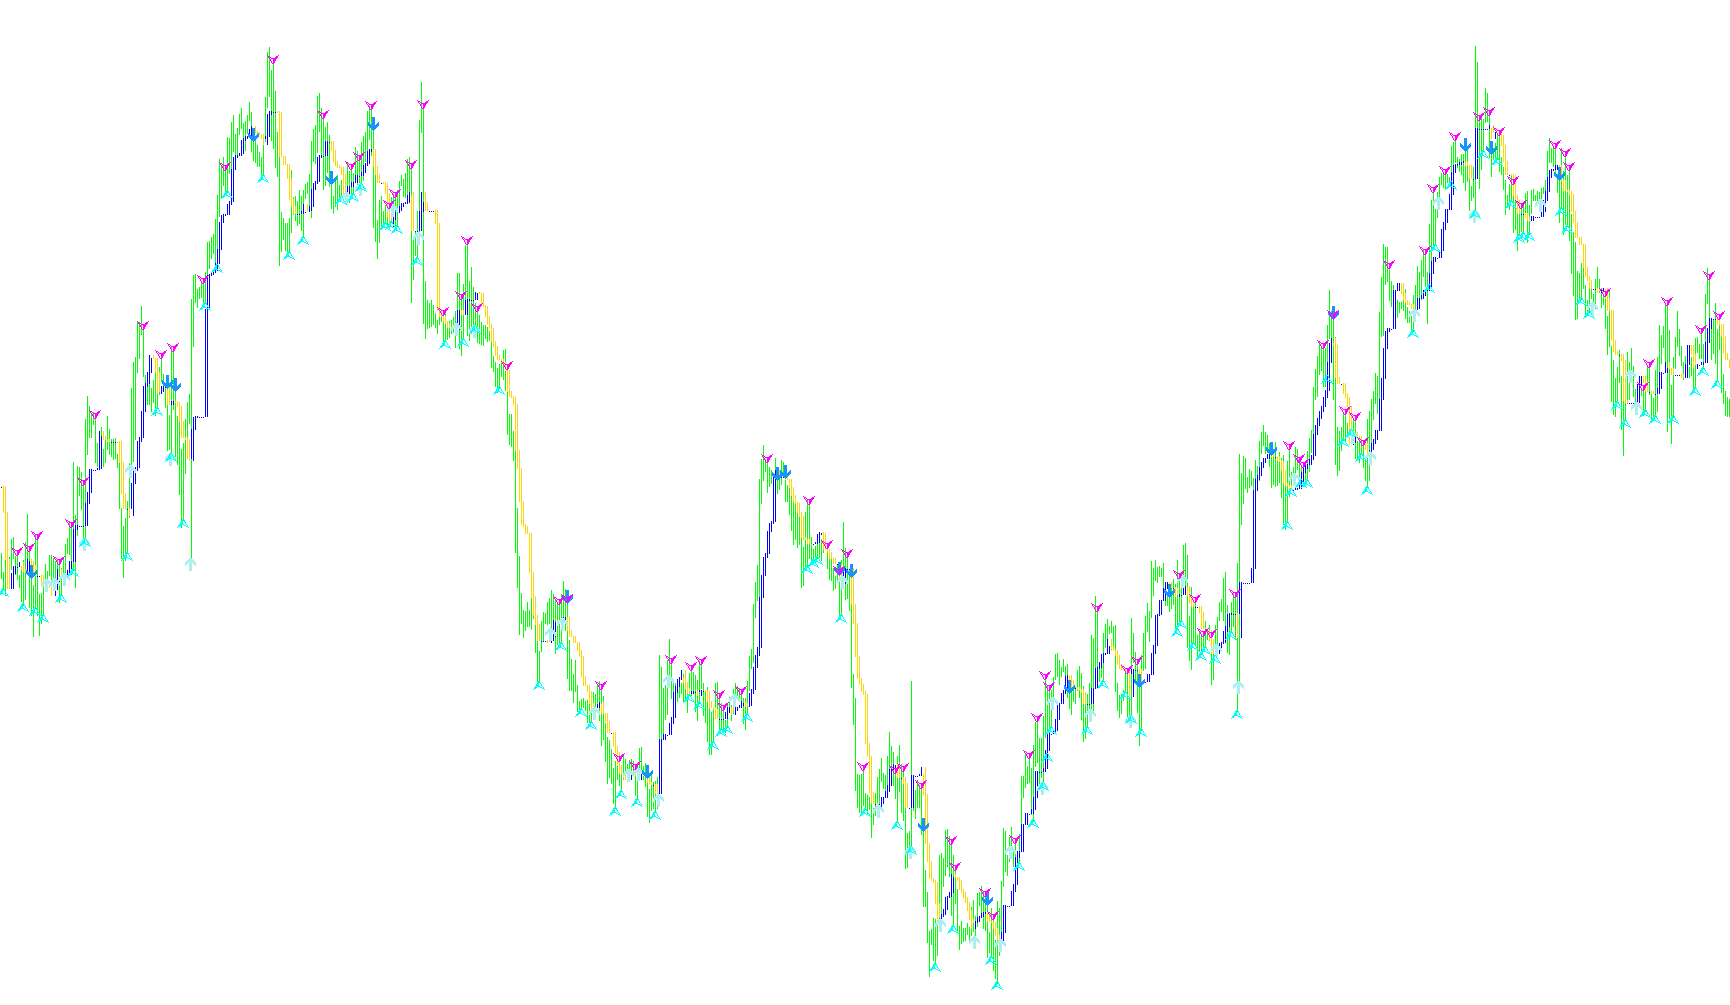
This indicator generates trading signals by aggregating a weighted score from five distinct technical dimensions: moving average momentum, CCI oscillators, predictive regression forecasting, RVI trend strength, and ADX directional volume.
RD-Combo_v1
Indicator

RD-Combo_v1

iCCIiADXiMAiRVI

A sophisticated trend-following system that aggregates price momentum, moving average crossovers, ADX strength, CCI oscillations, and regression-based forecast oscillators into a unified signal.

RD-Combo_v2
Indicator

RD-Combo_v2

iCCIiADXiMAiRVI

A multi-factor momentum engine that synthesizes smoothed moving averages, CCI, RVI, ADX strength, and a polynomial forecast oscillator to identify high-probability trend entries.

RD-Combo_v3
Indicator

RD-Combo_v3

iCCIiADXiMAiRVI

This indicator synthesizes momentum, trend velocity, and predictive regression analysis into a unified signal by aggregating data from Moving Averages, CCI, RVI, ADX, and a custom forecast oscillator.

RD-Combo_v5
Indicator

RD-Combo_v5

iCCIiADXiMAiRVI

This indicator aggregates momentum, trend, and volatility oscillators—specifically LWMA crossovers, CCI dynamics, RVI signal deviations, and ADX strength—into a unified consensus scoring system to identify high-probability trend entries.

Real_Time_MultiIndicator_v1
Indicator

Real_Time_MultiIndicator_v1

iMACDiADXiMAiSAR

This indicator aggregates signal data from Parabolic SAR, MACD, Moving Average crossovers, and ADX across multiple timeframes into a synchronized visual dashboard.

SAR_ADX_sBar_mtf
Indicator

SAR_ADX_sBar_mtf

iADXiSAR

This indicator synthesizes Parabolic Stop and Reverse levels with Average Directional Index dynamics across multiple timeframes to visualize trend polarity and momentum intensity through a unified color-coded sidebar.

sar_AUTO_STOP_REVERS
Indicator

sar_AUTO_STOP_REVERS

iADXiSAR

This indicator identifies trend shifts by signaling potential reversals when ADX strength transitions across the 25-40 corridor relative to its prior momentum.

SDX-TzPivots-alerts
Indicator

SDX-TzPivots-alerts

iForceiADXiRSI
SDX-TzPivots-alerts_test
Indicator

SDX-TzPivots-alerts_test

iForceiADXiRSI
SDX-TzPivots-alerts_test1
Indicator

SDX-TzPivots-alerts_test1

iACiCCIiDeMarkeriATR
SDX-TzPivots_mod
Indicator

SDX-TzPivots_mod

iForceiADXiRSI
Sem SAR+ADX+StDev
Indicator

Sem SAR+ADX+StDev

iADXiSARiStdDev

This indicator maps standard deviation values into four distinct histogram zones based on the intersection of Parabolic SAR trend flips and ADX directional strength.

Sem SAR+ADX
Indicator

Sem SAR+ADX

iADXiSAR

This indicator identifies high and low probability trend reversal points by cross-referencing the Parabolic SAR trajectory with the directional strength of the ADX (+DI/-DI) components.

ShortTermMomentumTrading
Indicator

ShortTermMomentumTrading

iCCIiADXiMA

This algorithm executes high-probability entries by synchronizing momentum shifts via Laguerre Filters, ADX trend strength, CCI overbought/oversold thresholds, and a dual-moving average crossover sequence.

sideway_or__trend_v_1_2_update
Indicator

sideway_or__trend_v_1_2_update

iADX

This indicator evaluates the Average Directional Index (ADX) and its component vectors to differentiate between low-momentum sideways range movements and high-momentum directional trends.

signal_trend_dan_op
Indicator

signal_trend_dan_op

iADXiMAiStochastic

Identifies market reversals by detecting stochastic line crossovers while filtering for price position relative to a moving average.

SmADX
Indicator

SmADX

iADX

This indicator applies a complex multi-stage weighted smoothing algorithm to the ADX, +DI, and -DI components to filter out market noise and identify latent directional trends.

SmADXbars
Indicator

SmADXbars

iADXiMAOnArray

This indicator dynamically maps price extremes based on the dominance of directional indices and applies a moving average to these shifted values to identify trend-biased price levels.

Indicator

snowseed-eCLV

iADX
Squeeze_Break
Indicator

Squeeze_Break

iATRiMACDiADXiRSI

This indicator identifies potential market breakouts by detecting when Bollinger Bands expand beyond Keltner Channels, filtered by Momentum to confirm trend bias.

Squeeze_Break_v1
Indicator

Squeeze_Break_v1

iATRiMACDiADXiRSI

This system identifies trend reversals by detecting periods of low volatility via Bollinger Band and Keltner Channel convergence, triggering alerts when price momentum confirms an expansion into a high-volatility state.

t3_adx_+di_-di_burst
Indicator

t3_adx_+di_-di_burst

iADX

This indicator applies a triple-smoothed T3 moving average filter to the Plus Directional Index and Minus Directional Index to identify volatile trend transitions.

t3_adx_+di_-di_burst_v1
Indicator

t3_adx_+di_-di_burst_v1

iADX

This indicator applies a triple-smoothed T3 filter to the Plus and Minus Directional Indicators to isolate high-velocity trend shifts while filtering out micro-fluctuations.

t3_adx_+di_-di_burst_v2
Indicator

t3_adx_+di_-di_burst_v2

iADX

This indicator applies a triple-exponential smoothing T3 filter to the Plus DI and Minus DI components to identify stabilized trend momentum and directional bursts.

t3_ADX_PlusDi_MinusDi_Burst
Indicator

t3_ADX_PlusDi_MinusDi_Burst

iADX

This indicator applies a triple-smoothed T3 moving average filter to the directional components of the ADX to isolate and amplify trend acceleration signals.

Indicator

Tabelka_kontrolna_PL

iADiACiAlligatoriFractals
TASSKlT
Indicator

TASSKlT

iADX

This indicator identifies high-probability trend entries by detecting concurrent upward growth across three distinct ADX periods while filtering for specific directional bias and momentum thresholds.

ThreeCombo_v2
Indicator

ThreeCombo_v2

iADXiMAiRSI

This indicator identifies high-probability trend alignment by synchronizing moving average crossovers, RSI momentum thresholds, and ADX directional bias to filter actionable entries.

Indicator

TH_MTF_Bar1.4_alerts

iCCIiMACDiADXiOsMA
Indicator

Tickwatcher

iAOiADXiSAR
Tickwatcher3
Indicator

Tickwatcher3

iADX

This indicator synchronizes ADX strength and Heiken Ashi price action across multiple timeframes to provide a unified visual dashboard of trend momentum.

tmagiq
Indicator

tmagiq

iADXiMAiMAOnArray

This indicator quantifies price volatility by calculating the absolute variance between three moving averages and scaling the resulting magnitude by the ADX directional difference.

TorR.11
Indicator

TorR.11

iADX

This indicator evaluates market dynamics across multiple timeframes by analyzing ADX thresholds and directional index velocity to distinguish between active trends and consolidative ranges.

ToR_1.02
Indicator

ToR_1.02

iADX

This indicator visualizes real-time trend strength and direction across multiple timeframes simultaneously using ADX thresholds to differentiate between active momentum and stagnant consolidation.

ToR_1.10
Indicator

ToR_1.10

iADX

This indicator analyzes Average Directional Index (ADX) values across five distinct timeframes to distinguish between trending and ranging market states, utilizing visual cues for momentum strength and directional bias.

ToR_1.12
Indicator

ToR_1.12

iADX

This indicator evaluates market dynamics across multiple timeframes by calculating ADX levels and DI crossovers to distinguish between ranging, strengthening, and weakening trends.

ToR_1.20
Indicator

ToR_1.20

iCCIiADX

This indicator simultaneously analyzes ADX and CCI across multiple timeframes to distinguish between high-momentum trends and low-volatility ranging environments.

ToR_1.20_v1
Indicator

ToR_1.20_v1

iCCIiADX

This indicator synchronizes ADX and CCI data across multiple timeframes to visualize real-time market regime shifts between trending momentum and ranging consolidation.

ToR_1[1].02
Indicator

ToR_1[1].02

iADX

This indicator synthesizes multi-timeframe ADX values and directional indicators to visually distinguish between trending momentum, ranging consolidation, and potential trend reversals.

ToR_1[2].02
Indicator

ToR_1[2].02

iADX

This indicator synthesizes ADX values across multiple temporalities to distinguish between high-velocity trending phases and low-momentum consolidation zones.

ToR_1[3].02
Indicator

ToR_1[3].02

iADX

This indicator evaluates market dynamics by synchronizing ADX strength and directional indicators across multiple timeframes to distinguish between trending, ranging, and transitional price states.

ToR_1[3].03
Indicator

ToR_1[3].03

iADX

This indicator evaluates market structure by monitoring ADX strength across various timeframes to distinguish between active trending momentum and sideways ranging behavior.

ToR_1[3][1].03
Indicator

ToR_1[3][1].03

iADX

This indicator synthesizes ADX values across six concurrent timeframes to visually distinguish between high-momentum trends, directional shifts, and sideways price consolidation.

TrackTrend_MACD_Color
Indicator

TrackTrend_MACD_Color

iMACDiADXiRSI

This indicator synchronizes and visualizes real-time trend orientation across multiple timeframes by evaluating MACD main and signal line momentum shifts.

TrendForce
Indicator

TrendForce

iCCIiMACDiADXiMA
TrendForce_3
Indicator

TrendForce_3

iCCIiMACDiADXiMA
TrendManagerNT
Indicator

TrendManagerNT

iADX

This indicator identifies trend reversals by monitoring price extremes and momentum shifts, utilizing a dual-span calculation validated by ADX strength and custom trend divergence thresholds.

TrendManagerNT1
Indicator

TrendManagerNT1

iADX

This indicator identifies high-probability trend reversals by correlating dual-span price pivots with ADX momentum strength and proprietary NewTrend divergence filters.

Trends_v1
Indicator

Trends_v1

iForceiADXiRSI