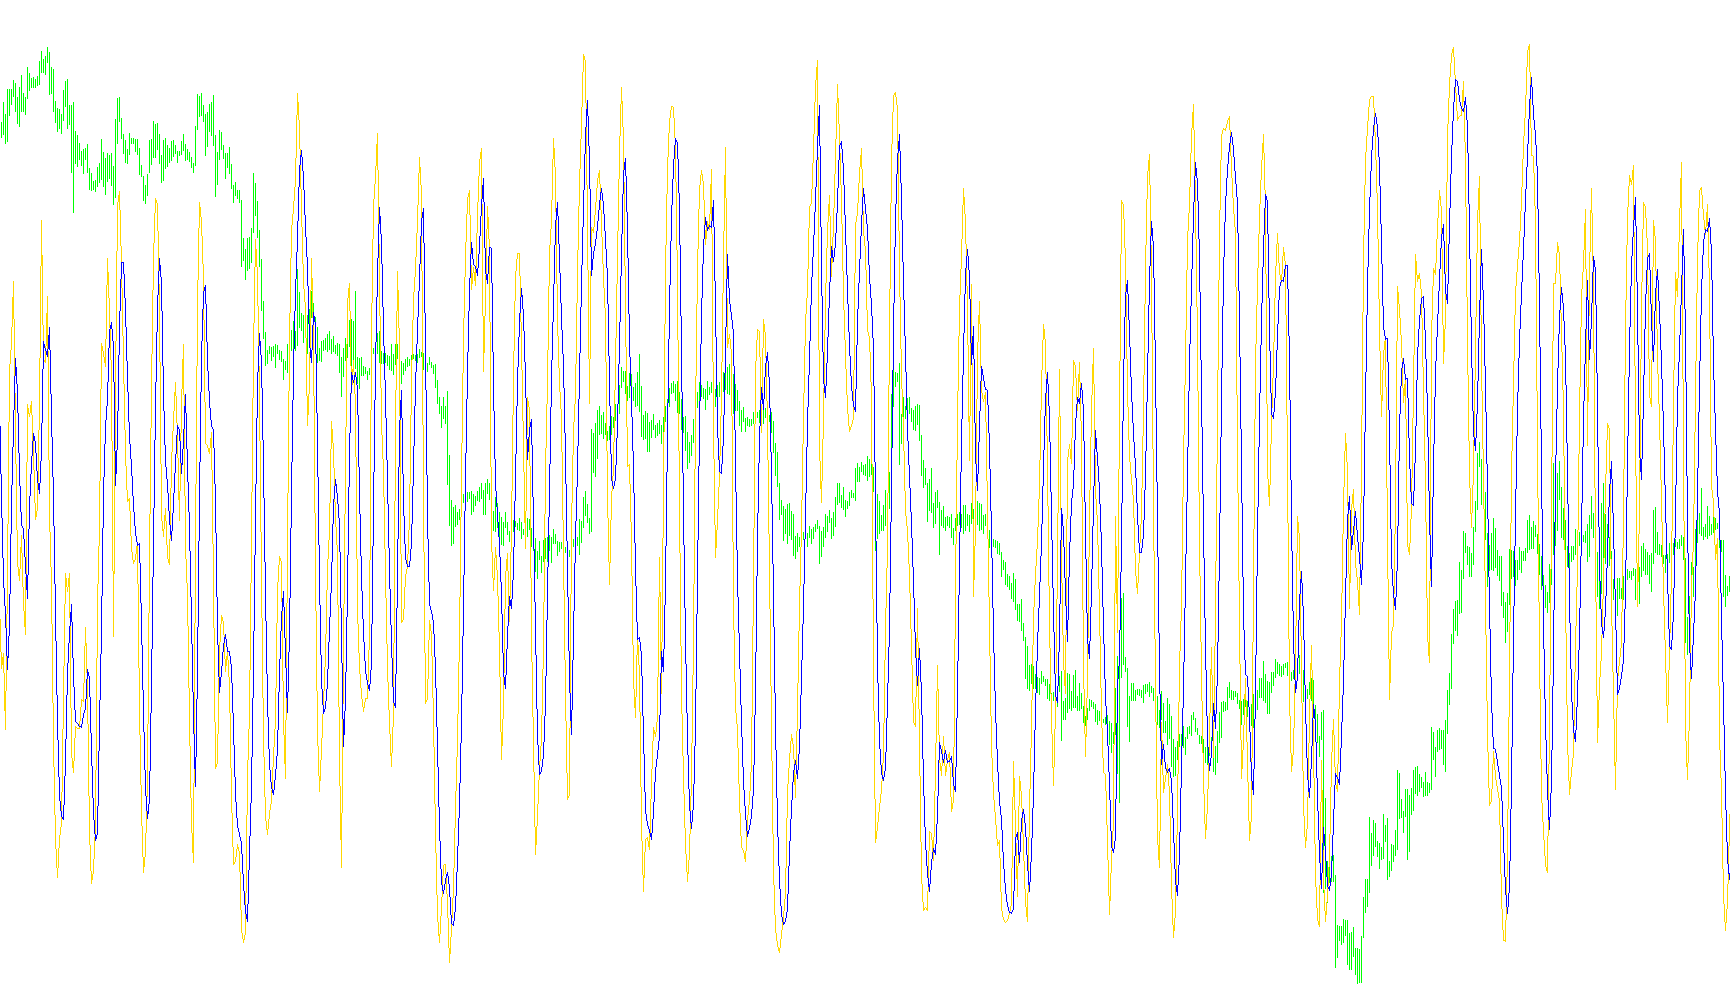
This script functions as a specialized technical analysis tool designed to visualize market momentum by combining three distinct types of financial data into a single, cohesive visual output. Rather than relying on a single price metric, it creates a "3D" perspective of the market by layering different mathematical perspectives on top of one another.
How the Logic Works
The core logic of the script revolves around three primary data components that work together to determine the overall trend:
1. Relative Strength (RSI Analysis) The tool begins by evaluating the "Relative Strength Index." This is a standard way to see whether an asset is being bought or sold aggressively. The script doesn't just look at the current strength; it looks back over a specific period to establish a baseline of what "normal" behavior looks like for that timeframe.
2. Dynamic Range Scaling (Stochastic Behavior) Instead of looking at the raw strength alone, the script identifies the highest and lowest levels reached by that strength over a secondary look-back window. By calculating where the current price sits relative to these highs and lows, it determines the "position" of the current movement. This helps filter out minor fluctuations and highlights whether the market is reaching an extreme point (overbought or oversold).
3. Price Momentum Integration (CCI) To ground these mathematical calculations in actual price action, the script incorporates a Commodity Channel Index (CCI). This measures how far the current price has deviated from its average. By mixing this with the strength data mentioned above, the tool can distinguish between a price move that has "volume" and one that is just a momentary spike.
The Final Synthesis
The script blends these three elements together using weighted variables:
- Weighting: It uses a specific "hot" factor to decide how much influence the price momentum (CCI) should have compared to the relative strength calculations.
- Smoothing: Because raw market data can be jagged and erratic, the script applies a dual-layer smoothing process. This ensures that the resulting lines on your chart are fluid and easy to read, reducing "noise" while still reacting quickly enough to significant trend changes.
Summary for Traders
In simple terms, this indicator acts like a filter. It takes complex data regarding price history, current momentum, and relative strength, blends them together, and smooths out the results. The goal is to provide you with a clearer picture of the market's "pulse," helping to identify the direction and intensity of a trend more effectively than any single indicator could do on its own.
/*-----------------------------+
|			       |
| Shared by www.Aptrafx.com    |
|			       |
+------------------------------*/

//+------------------------------------------------------------------+
//|                                                 3D Oscilator.mq4 |
//|                                                                  |
//|                                                                  |
//+------------------------------------------------------------------+
#property copyright "Author - Luis Damiani. Ramdass - Conversion only"

#property indicator_separate_window
#property indicator_buffers 2
#property indicator_color1 Yellow
#property indicator_color2 Red
//---- input parameters

extern int D1RSIPer=13;
extern int D2StochPer=8;
extern int D3tunnelPer=8;
extern double hot=0.4;
extern int sigsmooth=4;


//---- buffers
double sig1n[];
double sig2n[];
//+------------------------------------------------------------------+
//| Custom indicator initialization function                         |
//+------------------------------------------------------------------+
int init()
  {
   string short_name;
//---- indicator line
   SetIndexStyle(0,DRAW_LINE);
   SetIndexStyle(1,DRAW_LINE);
   SetIndexBuffer(0,sig1n);
   SetIndexBuffer(1,sig2n);
//----
   SetIndexDrawBegin(0,D1RSIPer+D2StochPer+D3tunnelPer+hot+sigsmooth);
   SetIndexDrawBegin(1,D1RSIPer+D2StochPer+D3tunnelPer+hot+sigsmooth);
//----
   return(0);
  }
//+------------------------------------------------------------------+
//| CCI_Woodies                                                         |
//+------------------------------------------------------------------+
int start()
  {
   int i,i2,counted_bars=IndicatorCounted();
   double rsi,maxrsi,minrsi,storsi,E3D,
   sig1,sig2,sk,ss,sk2;
   double cs;
   bool init=true;
//----
   cs= D1RSIPer+D2StochPer+D3tunnelPer+hot+sigsmooth;
   if(Bars<=cs) return(0);

//if (init)
//{
ss=sigsmooth;
if (ss<2) ss=2;
sk = 2 / (ss + 1);
sk2=2/(ss*0.8+1);
init=false;
//};


//---- initial zero
   if(counted_bars<1)
   {
      for(i=1;i<=cs;i++) sig1n[Bars-i]=0.0;
      for(i=1;i<=cs;i++) sig2n[Bars-i]=0.0;
   }
//----
   i=Bars-cs-1;


   if(counted_bars>=cs) i=Bars-counted_bars-1;
   while(i>=0)
     {

      rsi=iRSI(NULL,0,D1RSIPer,PRICE_CLOSE,i);
maxrsi=rsi;
minrsi=rsi;

for (i2=i+D2StochPer;i2>=i; i2--)
{
rsi=iRSI(NULL,0,D1RSIPer,PRICE_CLOSE,i2);
if (rsi>maxrsi) maxrsi=rsi;
if (rsi<minrsi) minrsi=rsi;
//maxrsi=Maximum(rsi,maxrsi);
//minrsi=min(rsi,minrsi);
}

storsi=((rsi-minrsi)/(maxrsi-minrsi)*200-100);
E3D=hot*iCCI(NULL,0,D3tunnelPer,PRICE_TYPICAL,i)+(1-hot)*storsi;
sig1n[i]=sk*E3D+(1-sk)*sig1;
sig2n[i]=sk2*sig1+(1-sk2)*sig2;
sig1=sig1n[i];
sig2=sig2n[i];

      i--;
     }
   return(0);
  }
//+------------------------------------------------------------------+
Comments