Accelerator_LSMA1_v1
Download script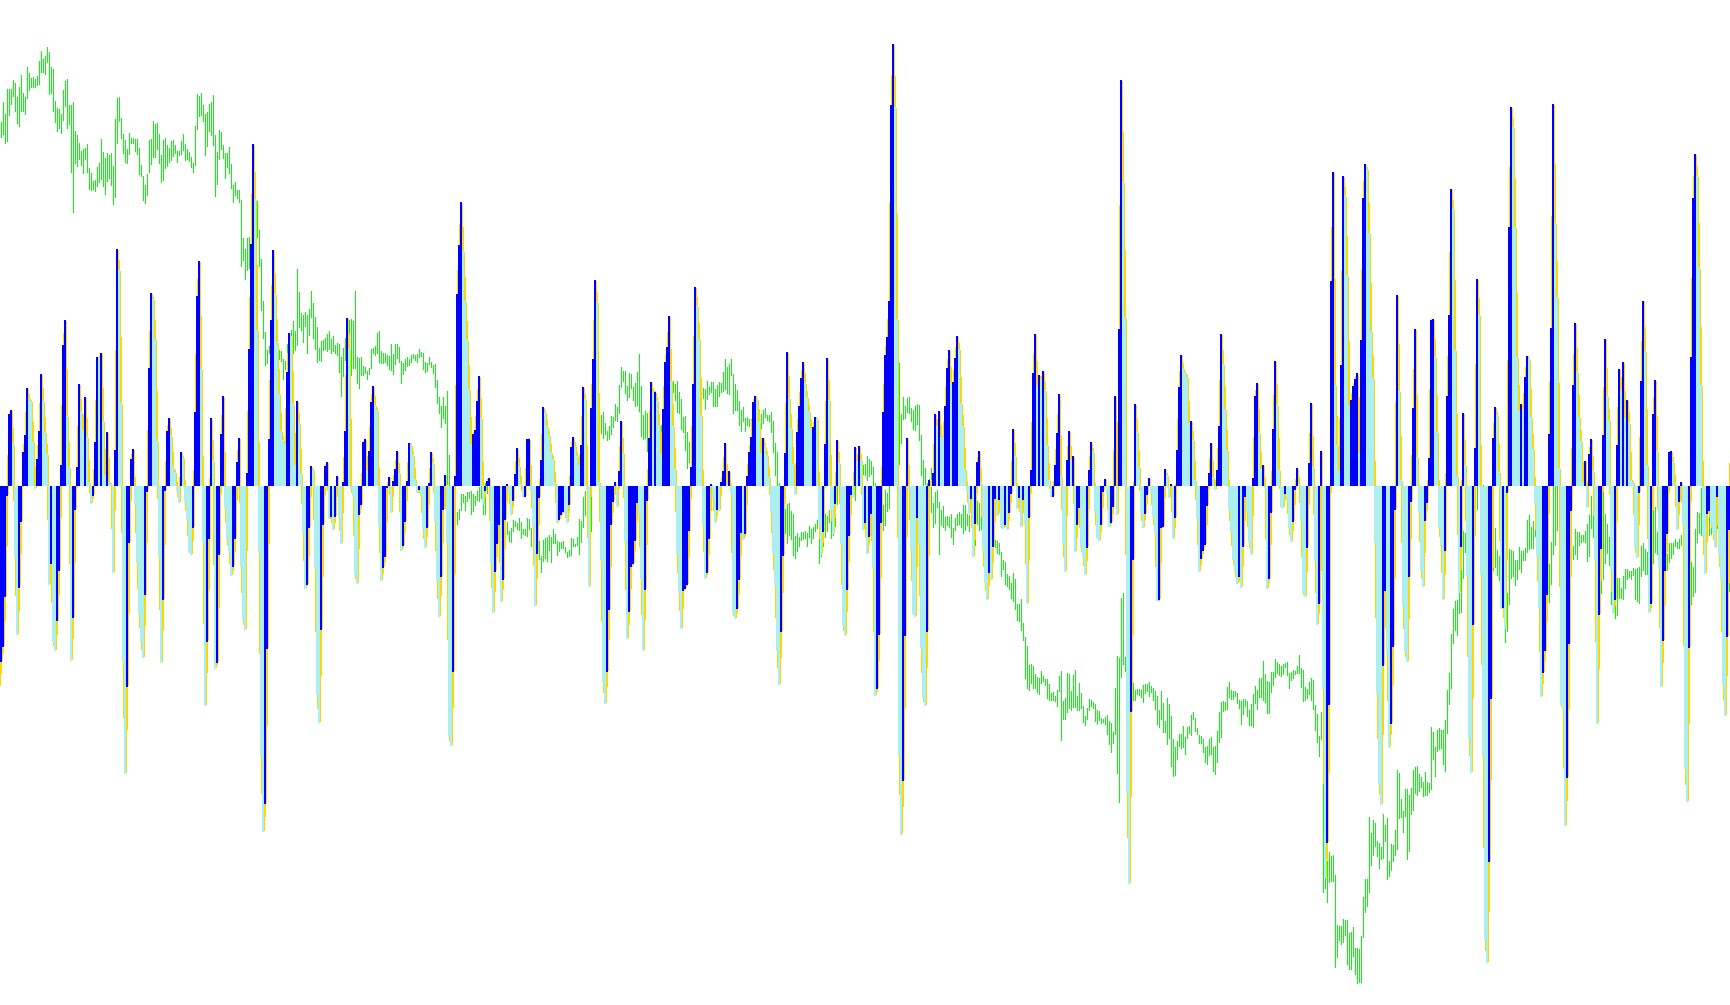
This tool is designed to help traders visualize the momentum and strength of price movements by calculating the "acceleration" or "deceleration" of a market trend. Instead of looking at simple price changes, it analyzes how the speed of the trend itself is shifting over time.
Core Mathematical Logic
The script operates using three primary layers of logic to filter out market noise and identify clear trends:
1. The Least Squares Moving Average (LSMA) At its foundation, the tool uses a sophisticated type of moving average known as "Least Squares." Unlike standard moving averages that simply average past prices, this method uses linear regression. It attempts to find the "best fit" line for a specific set of price data points. This allows it to react more smoothly to significant price trends while ignoring minor, insignificant fluctuations.
2. Momentum Differentiation The tool compares two different LSMA speeds simultaneously: a fast-moving average (shorter period) and a slow-moving average (longer period). By subtracting the slow value from the fast value, the script identifies the "gap" between them. This gap represents the current momentum of the market; when the gap widens, momentum is increasing; when it narrows, momentum is slowing down.
3. Signal Filtering To ensure the data is readable and actionable, the tool creates a "Signal Line." It takes the results of the momentum calculation and applies yet another moving average to it. This acts as a secondary confirmation layer, smoothing out any remaining erratic jumps in the data.
Visual Interpretation
The final output is displayed in a separate window and uses a color-coded system to communicate market direction to the user:
- Trend Direction: The script compares the current momentum gap against the previous one. If the current gap is higher than the previous one, it identifies an upward trend. If it is lower, it identifies a downward trend.
- Visual Cues:
- The Main Line: Represents the raw calculation of the momentum difference, scaled for easier viewing.
- The Histograms: These act as visual switches. One color (Green) will light up when the momentum is increasing (Accelerating), and the other color (Red) will light up when the momentum is decreasing (Decelerating).
By monitoring these shifts, a user can see not just where the price is going, but whether the current move has "fuel" behind it or if the trend is beginning to exhaust itself.
/*-----------------------------+
|			       |
| Shared by www.Aptrafx.com    |
|			       |
+------------------------------*/

//+------------------------------------------------------------------+
//|                                             Accelerator_LSMA.mq4 |
//|                      Copyright © 2005, MetaQuotes Software Corp. |
//|                                       http://www.metaquotes.net/ |
//+------------------------------------------------------------------+
#property  copyright "Copyright © 2005, MetaQuotes Software Corp."
#property  link      "http://www.metaquotes.net/"
//---- indicator settings
#property  indicator_separate_window
#property  indicator_buffers 3
#property  indicator_color1  Yellow
#property  indicator_color2  Green
#property  indicator_color3  Red

#property indicator_level1 0.0
//---- indicator buffers
double     ExtBuffer0[];
double     ExtBuffer1[];
double     ExtBuffer2[];
double     ExtBuffer3[];
double     ExtBuffer4[];
//+------------------------------------------------------------------+
//| Custom indicator initialization function                         |
//+------------------------------------------------------------------+
int init()
  {
//---- 2 additional buffers are used for counting.
   IndicatorBuffers(5);
//---- drawing settings
   SetIndexStyle(0,DRAW_LINE,STYLE_SOLID,2);
   SetIndexStyle(1,DRAW_HISTOGRAM,STYLE_SOLID,2);
   SetIndexStyle(2,DRAW_HISTOGRAM,STYLE_SOLID,2);
   IndicatorDigits(Digits+2);
   SetIndexDrawBegin(0,38);
   SetIndexDrawBegin(1,38);
   SetIndexDrawBegin(2,38);
//---- 4 indicator buffers mapping
   SetIndexBuffer(0,ExtBuffer0);
   SetIndexBuffer(1,ExtBuffer1);
   SetIndexBuffer(2,ExtBuffer2);
   SetIndexBuffer(3,ExtBuffer3);
   SetIndexBuffer(4,ExtBuffer4);
//---- name for DataWindow and indicator subwindow label
   IndicatorShortName("AC");
   SetIndexLabel(1,NULL);
   SetIndexLabel(2,NULL);
//---- initialization done
   return(0);
  }

//+------------------------------------------------------------------------+
//| LSMA - Least Squares Moving Average function calculation               |
//| LSMA_In_Color Indicator plots the end of the linear regression line    |
//+------------------------------------------------------------------------+

double LSMA(int Rperiod, int shift)
{
   int i;
   double sum;
   int length;
   double lengthvar;
   double tmp;
   double wt;

   length = Rperiod;

   sum = 0;
   for(i = length; i >= 1  ; i--)
   {
     lengthvar = length + 1;
     lengthvar /= 3;
     tmp = 0;
     tmp = ( i - lengthvar)*Close[length-i+shift];
     sum+=tmp;
    }
    wt = sum*6/(length*(length+1));

    return(wt);
}


//+------------------------------------------------------------------+
//| Accelerator/Decelerator Oscillator                               |
//+------------------------------------------------------------------+
int start()
  {
   int    limit;
   int    counted_bars=IndicatorCounted();
   double prev,current;
   //---- last counted bar will be recounted
   if(counted_bars>0) counted_bars--;
   limit=Bars-counted_bars;
   //---- macd counted in the 1-st additional buffer
   for(int i=0; i<limit; i++)
      ExtBuffer3[i]=LSMA(5,i)-LSMA(34,i);
   //---- signal line counted in the 2-nd additional buffer
   for(i=0; i<limit; i++)
      ExtBuffer4[i]=iMAOnArray(ExtBuffer3,Bars,5,0,MODE_SMA,i);
   //---- dispatch values between 2 buffers
   bool up=true;
   for(i=limit-1; i>=0; i--)
     {
      current=ExtBuffer3[i]-ExtBuffer4[i];
      prev=ExtBuffer3[i+1]-ExtBuffer4[i+1];
      if(current>prev) up=true;
      if(current<prev) up=false;
      if(!up)
        {
         ExtBuffer2[i]=current*100;
         ExtBuffer1[i]=0.0;
        }
      else
        {
         ExtBuffer1[i]=current*100;
         ExtBuffer2[i]=0.0;
        }
       ExtBuffer0[i]=current*100;
     }
   //---- done
   return(0);
  }
Comments