CAO
Download script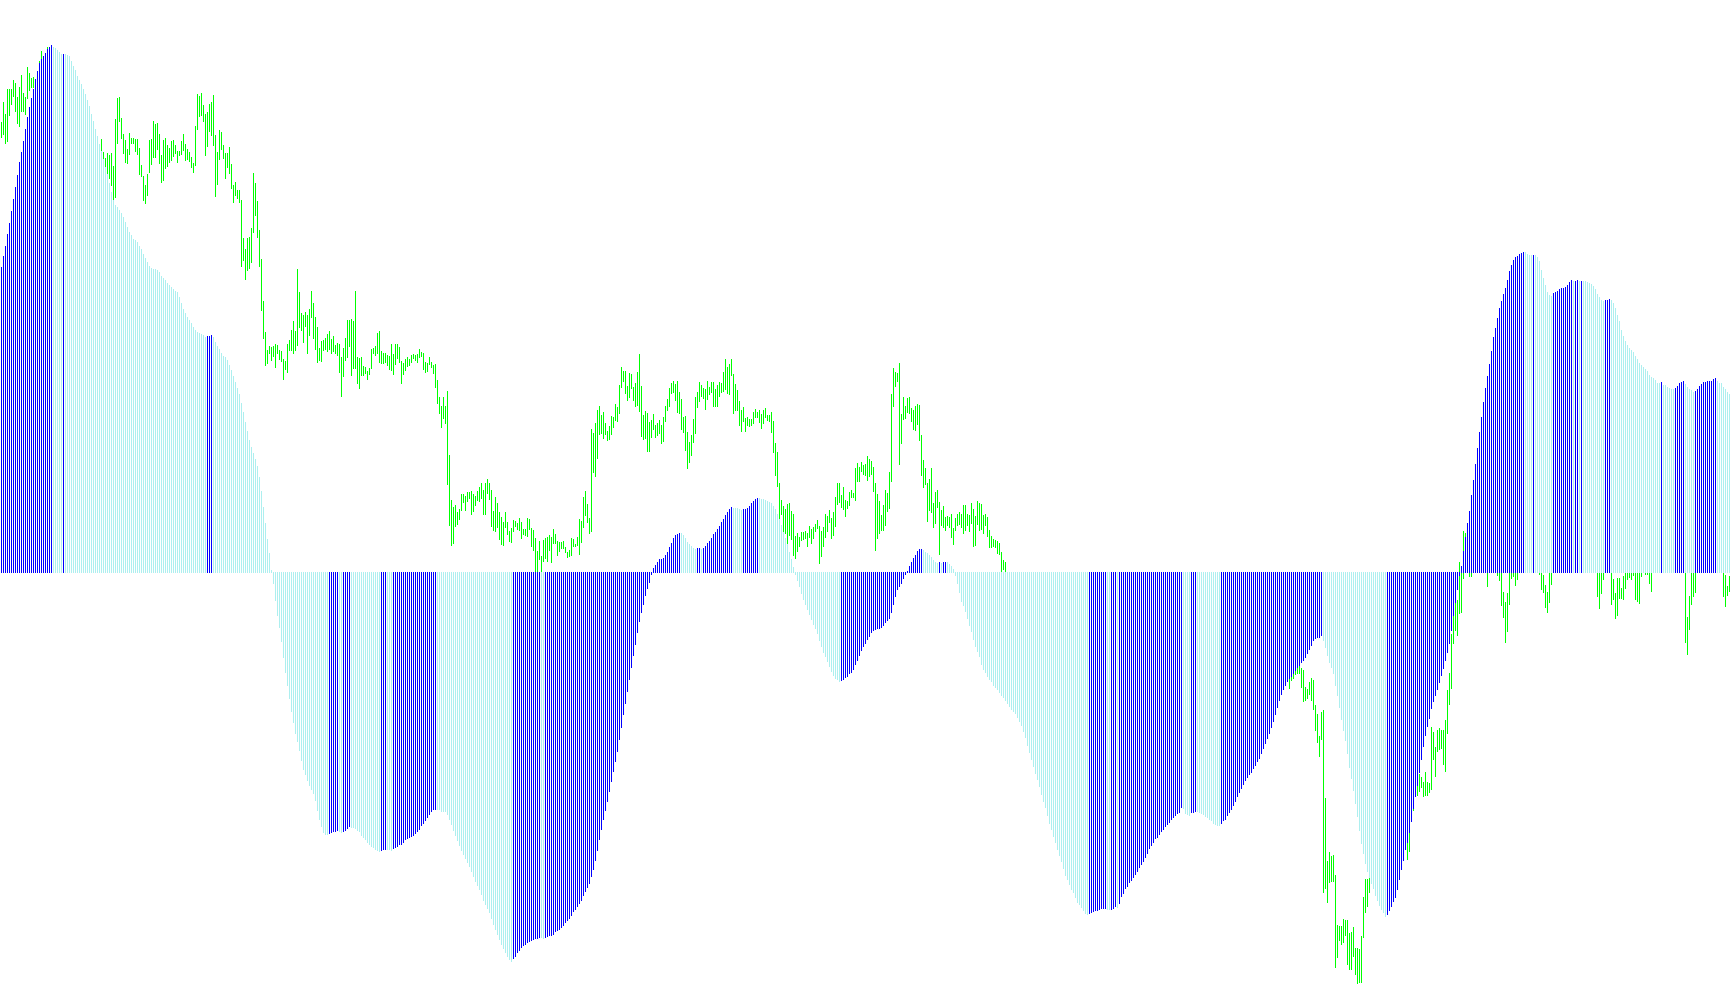
This script is a custom technical analysis tool designed to help traders visualize momentum and trend direction in the financial markets. It functions as a visual aid that identifies whether the current market movement is gaining strength or losing steam by comparing different timeframes of price action.
Core Mechanics
The logic operates in two primary stages:
1. Momentum Calculation The tool begins by calculating the difference between two moving averages—one that tracks short-term price changes and another that tracks long-term trends. By subtracting the long-term average from the short-term average, the script produces a "momentum" value. This tells the user how much faster (or slower) the current price is moving compared to its historical average.
2. Trend Directional Mapping Once the momentum value is established, the script analyzes the relationship between the current value and the previous one to determine the trend's trajectory:
- If the momentum is increasing, it signals upward movement.
- If the momentum is decreasing, it signals downward movement.
Visual Representation
To make this data easy to read at a glance, the script translates these calculations into a visual histogram in a separate window below your main price chart:
- Positive Momentum: When the trend is moving upward, the script highlights the data points in green.
- Negative Momentum: When the trend shifts downward, the script switches the visual output to red.
By providing this clear distinction between green and red visual cues, the tool allows traders to quickly identify shifts in market sentiment and potential turning points without having to manually calculate complex averages.
//+------------------------------------------------------------------+
//|                                                          CAO.mq4 |
//|                      Copyright © 2005, MetaQuotes Software Corp. |
//|                                       http://www.metaquotes.net/ |
//+------------------------------------------------------------------+
#property  copyright "Copyright © 2005, MetaQuotes Software Corp."
#property  link      "http://www.metaquotes.net/"
//---- indicator settings
#property  indicator_separate_window
#property  indicator_buffers 3
#property  indicator_color1  Black
#property  indicator_color2  Green
#property  indicator_color3  Red

//---- indicator buffers
double     ExtBuffer0[];
double     ExtBuffer1[];
double     ExtBuffer2[];

extern int ShortMA=32;
extern int LongMA=208;

//+------------------------------------------------------------------+
//| Custom indicator initialization function                         |
//+------------------------------------------------------------------+
int init()
  {
   //---- drawing settings
   SetIndexStyle(0,DRAW_NONE);
   SetIndexStyle(1,DRAW_HISTOGRAM,EMPTY,1);
   SetIndexStyle(2,DRAW_HISTOGRAM,EMPTY,1);
   IndicatorDigits(Digits+1);
   SetIndexDrawBegin(0,32);
   SetIndexDrawBegin(1,32);
   SetIndexDrawBegin(2,32);
//---- 3 indicator buffers mapping
   SetIndexBuffer(0,ExtBuffer0);
   SetIndexBuffer(1,ExtBuffer1);
   SetIndexBuffer(2,ExtBuffer2);
//---- name for DataWindow and indicator subwindow label
   IndicatorShortName("CAO("+ShortMA+","+LongMA+")");
   SetIndexLabel(1,NULL);
   SetIndexLabel(2,NULL);
//---- initialization done
   return(0);
  }
//+------------------------------------------------------------------+
//| Awesome Oscillator                                               |
//+------------------------------------------------------------------+
int start()
  {
   int    limit;
   int    counted_bars=IndicatorCounted();
   double prev,current;
//---- last counted bar will be recounted
   if(counted_bars>0) counted_bars--;
   limit=Bars-counted_bars;
//---- macd
   for(int i=0; i<limit; i++)
      ExtBuffer0[i]=iMA(NULL,0,ShortMA,0,MODE_SMA,PRICE_CLOSE,i)-iMA(NULL,0,LongMA,0,MODE_SMA,PRICE_CLOSE,i);
//---- dispatch values between 2 buffers
   bool up=true;
   for(i=limit-1; i>=0; i--)
     {
      current=ExtBuffer0[i];
      prev=ExtBuffer0[i+1];
      if(current>prev) up=true;
      if(current<prev) up=false;
      if(!up)
        {
         ExtBuffer2[i]=current;
         ExtBuffer1[i]=0.0;
        }
      else
        {
         ExtBuffer1[i]=current;
         ExtBuffer2[i]=0.0;
        }
     }
//---- done
   return(0);
  }
Comments