ADX_HSm
Download script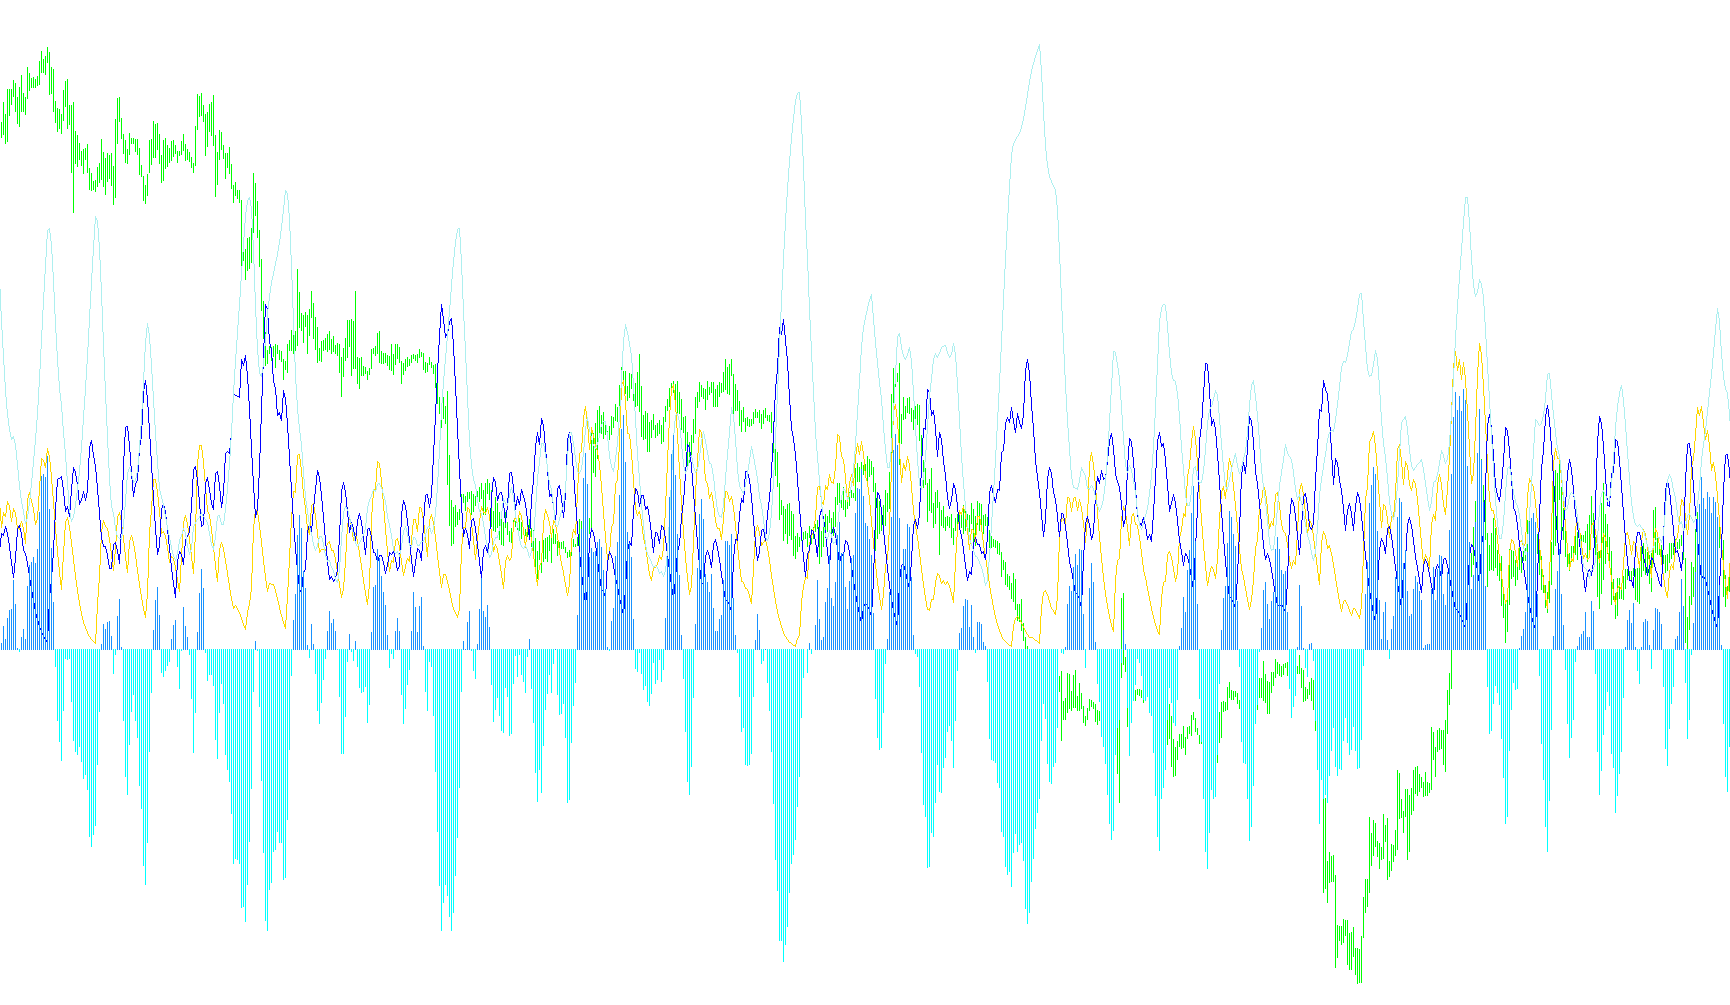
This technical indicator is designed to provide a smoother, more refined view of market trends and momentum compared to the standard ADX (Average Directional Index). It specifically employs advanced mathematical smoothing techniques to filter out market "noise," making it easier for traders to identify the underlying strength and direction of price movements.
Core Functionality
The script takes three primary components of market movement—the Plus Directional Indicator (DI+), the Minus Directional Indicator (DI-), and the Average Directional Index (ADX)—and subjects them to a multi-stage refinement process.
By applying two distinct layers of smoothing, the tool aims to eliminate erratic price fluctuations that often cause "false signals" in standard indicators. This allows for a clearer visualization of whether the market is trending strongly or moving sideways.
The Smoothing Logic
The logic operates through a two-step mathematical progression:
-
Primary Refinement (Lead Calculation): The script first processes the raw data using a specific smoothing coefficient (alpha1). This step calculates a "lead" value for the DI+ and DI- lines, as well as the ADX. This serves as the initial layer of stabilization, rounding off sharp corners in the data to create a more fluid trajectory.
-
Secondary Refinement (Final Output): The results from the first step are then passed through a second smoothing filter (alpha2). This final pass produces the polished lines seen on your trading chart. By doubling the smoothing effect, the indicator provides a highly stable visual representation of price momentum.
Visual Components
- DI Plus & DI Minus: These lines represent the strength of upward and downward price pressure, respectively. Because they are smoothed, they move more gracefully across the screen than standard versions.
- ADX Line: This represents the overall "strength" of the trend regardless of direction. A rising ADX suggests a strong trending market, while a flat or falling ADX indicates a range-bound or weak market.
- Histogram Component: The script also calculates the difference between the DI Plus and DI Minus. This is displayed as a histogram to provide a quick visual cue:
- When one value is significantly higher than the other, the histogram highlights the dominant direction of the current move.
- The logic automatically separates these values so you can clearly see whether the "bullish" or "bearish" force is currently in the lead.
Summary for the User
Instead of reacting to every small twitch in price action, this script helps you see the "big picture." By smoothing the data twice, it highlights the core trend and identifies when momentum is truly shifting, providing a cleaner, more reliable environment for making informed trading decisions.
//+------------------------------------------------------------------+
//|                                                 ADX Smoothed.mq4 |
//|                       Rosh       smoothing   John Ehlers method  |
//|                      Copyright © 2007, MetaQuotes Software Corp. |
//|  ADX Sm  DI+- Hist  ki                 http://www.metaquotes.net |
//+------------------------------------------------------------------+
#property copyright "Copyright © 2007, MetaQuotes Software Corp."
#property link      "http://www.metaquotes.net"
//----
#property indicator_separate_window
#property indicator_buffers 5

#property indicator_color1 DarkBlue
#property indicator_color2 FireBrick
#property indicator_color3 DarkGreen
#property indicator_color4 Green
#property indicator_color5 Red

#property indicator_level1 20
#property indicator_levelstyle 4

#property indicator_levelcolor  DarkSlateGray

//---- input parameters
extern int    per = 14;
extern double alpha1 = 0.25;
extern double alpha2 = 0.33;
extern int    PriceType = 0;
//---- buffers
double HistBuffer1[];
double HistBuffer2[];
double DiPlusFinal[];
double DiMinusFinal[];
double ADXFinal[];
double DIPlusLead[];
double DIMinusLead[];
double ADXLead[];
//+------------------------------------------------------------------+
//| Custom indicator initialization function                         |
//+------------------------------------------------------------------+
int init()
  {
//---- indicators
   IndicatorBuffers(8);

   SetIndexStyle(0, DRAW_LINE);
   SetIndexBuffer(0, DiPlusFinal);
   SetIndexLabel(0, "Di Plus");
//----
   SetIndexStyle(1, DRAW_LINE);
   SetIndexBuffer(1, DiMinusFinal);
   SetIndexLabel(1, "Di Minus");
//----
   SetIndexStyle(2, DRAW_LINE);
   SetIndexBuffer(2, ADXFinal);
   SetIndexLabel(2, "ADX");
//----
   SetIndexBuffer(6, DIPlusLead);
   SetIndexBuffer(7, DIMinusLead);
   SetIndexBuffer(5, ADXLead);
//----
  SetIndexBuffer(3,HistBuffer1);
  SetIndexBuffer(4,HistBuffer2);

   SetIndexStyle(3,DRAW_HISTOGRAM);
   SetIndexStyle(4,DRAW_HISTOGRAM);

    SetIndexEmptyValue(3,EMPTY_VALUE);
    SetIndexEmptyValue(4,EMPTY_VALUE);

   SetIndexLabel(3,"");
   SetIndexLabel(4,"");

   IndicatorDigits(2);
   IndicatorShortName("ADX(" + per + ")smothed");
//----
   return(0);
  }
//+------------------------------------------------------------------+
//| Custom indicator deinitialization function                       |
//+------------------------------------------------------------------+
int deinit()
  {
//----
   return(0);
  }
//+------------------------------------------------------------------+
//| Custom indicator iteration function                              |
//+------------------------------------------------------------------+
int start()
  {
   int counted_bars = IndicatorCounted();
   int i, k, limit;
   double DIPlus, DIMinus, ADX, DIPlus1, DIMinus1, ADX1;
//----
   if(counted_bars == 0)
       limit = Bars - per - 1;
   if(counted_bars > 0)
       limit = Bars - counted_bars;
   for(i = limit; i >= 0; i--)
     {
       DIPlus = iADX(NULL, 0, per, PriceType, MODE_PLUSDI, i);
       DIMinus = iADX(NULL, 0, per, PriceType, MODE_MINUSDI, i);
       ADX = iADX(NULL, 0, per, PriceType, MODE_MAIN, i);
       DIPlus1 = iADX(NULL, 0, per, PriceType, MODE_PLUSDI, i + 1);
       DIMinus1 = iADX(NULL, 0, per, PriceType, MODE_MINUSDI, i + 1);
       ADX1 = iADX(NULL, 0, per, PriceType, MODE_MAIN, i + 1);
       //----
       DIPlusLead[i] = 2*DIPlus + (alpha1 - 2) * DIPlus1 +
                       (1 - alpha1) * DIPlusLead[i+1];
       DIMinusLead[i] = 2*DIMinus + (alpha1 - 2) * DIMinus1 +
                        (1 - alpha1) * DIMinusLead[i+1];
       ADXLead[i] = 2*ADX + (alpha1 - 2) * ADX1 + (1 - alpha1) * ADXLead[i+1];
     }
   for(i = limit; i >= 0; i--)
     {
       DiPlusFinal[i] = alpha2*DIPlusLead[i] + (1 - alpha2) * DiPlusFinal[i+1];
       DiMinusFinal[i] = alpha2*DIMinusLead[i] + (1 - alpha2) * DiMinusFinal[i+1];
       ADXFinal[i] = alpha2*ADXLead[i] + (1 - alpha2) * ADXFinal[i+1];
    HistBuffer1[i] =  DiPlusFinal[i]-DiMinusFinal[i];
    if  (HistBuffer1[i]<0) {HistBuffer2[i]=HistBuffer1[i]; HistBuffer1[i]=EMPTY_VALUE;}
     }
//----
   return(0);
  }
//+------------------------------------------------------------------+
Comments