ADXcrossesNon-repainting
Download script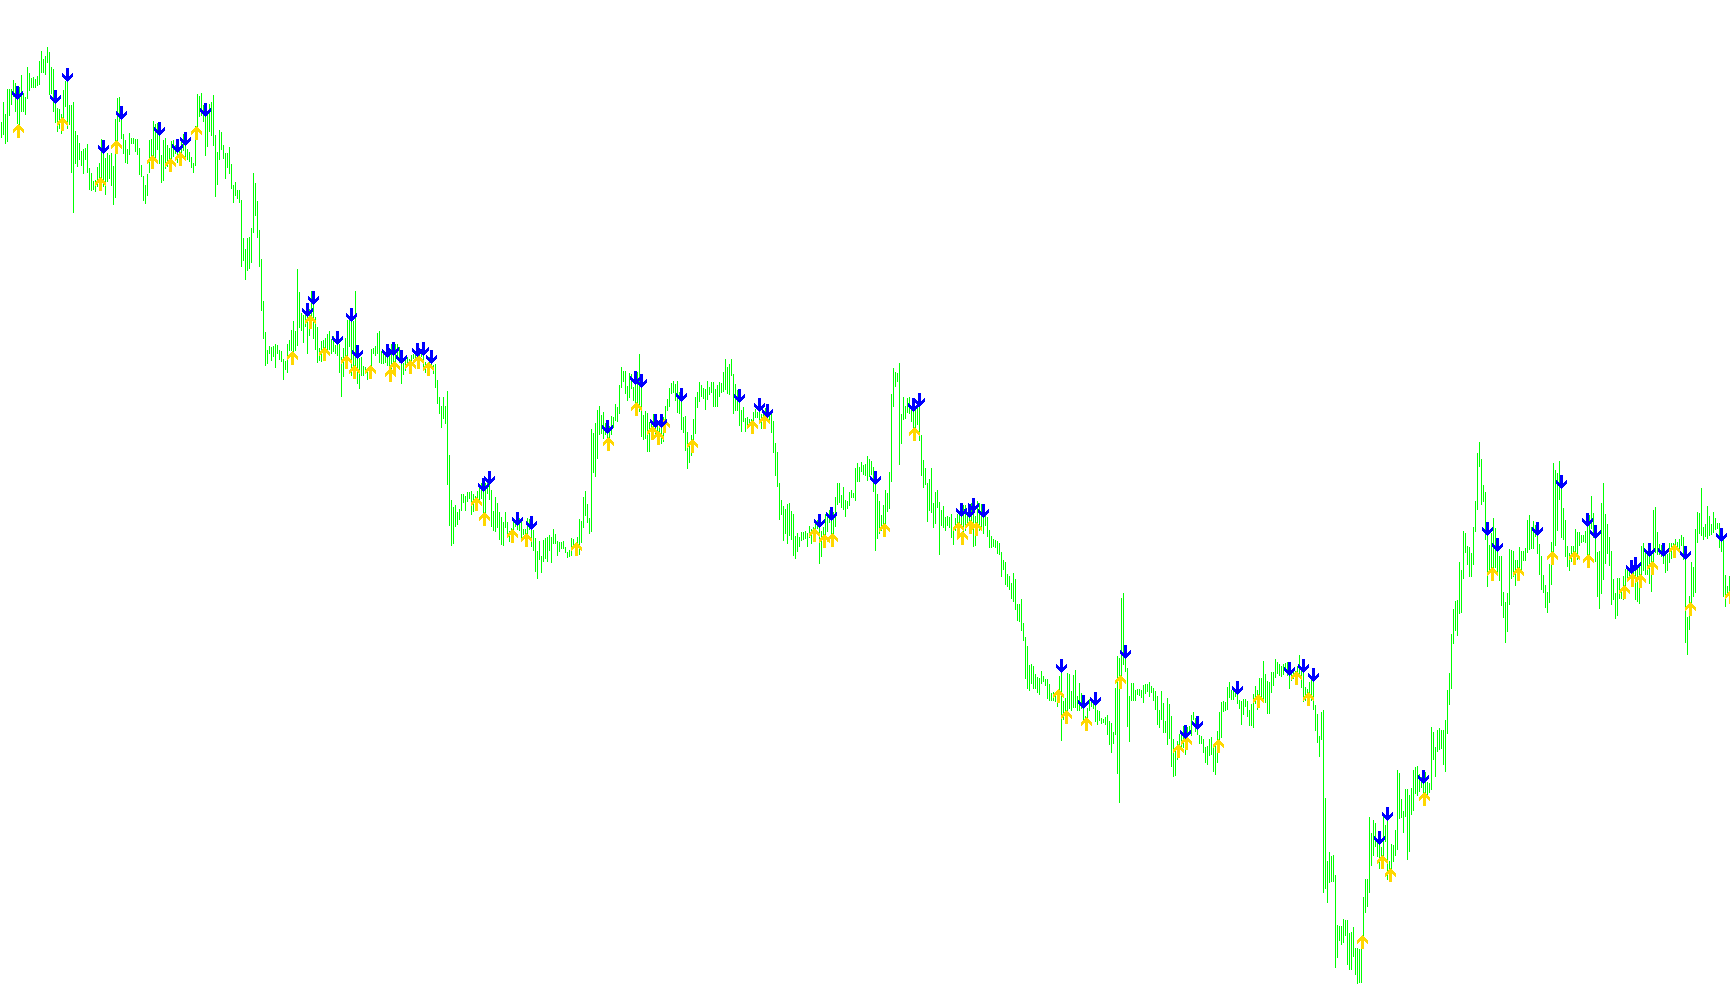
This script is designed for the MetaTrader trading platform to act as a visual signaling tool on your price charts. Its primary purpose is to identify specific "crossover" moments between two different trend-strength components, helping traders spot potential shifts in market momentum.
Core Functionality
The logic relies on a well-known technical analysis metric called the ADX (Average Directional Index). Specifically, it looks at two sub-components of this index:
- Plus DI (+DI): Generally associated with upward price pressure or bullish momentum.
- Minus DI (-DI): Generally associated with downward price pressure or bearish momentum.
The script constantly monitors these two values to see when they cross over each other, as these intersections often signal a change in the prevailing trend of the market.
How it Works on Your Chart
Instead of drawing complex lines that might clutter your view, this script provides clean visual cues:
- Bullish Signals (Upward Cross): When the "Plus DI" value moves from being below the "Minus DI" to moving above it, the script recognizes a potential shift toward upward momentum. It places a blue arrow at the bottom of the price candle to indicate this change.
- Bearish Signals (Downward Cross): Conversely, when the "Plus DI" moves from being above the "Minus DI" to moving below it, the script recognizes a potential shift toward downward momentum. It places a red arrow at the top of the price candle to highlight this move.
Adaptive Visualization
To ensure that these arrows are always clearly visible and do not overlap with the actual price candles, the script includes an intelligent spacing system. Depending on the timeframe you are viewing (e.g., a 1-minute chart versus a 4-hour chart), it automatically calculates a "buffer zone." This ensures that the arrows appear at a consistent, readable distance from the candles regardless of how zoomed in or out your chart is.
Summary for the User
Think of this script as an automated "cross-over" detector. It filters through the noise of price movements and highlights only the moments where the internal momentum shifts direction, marking them with clear visual arrows to help you identify potential entry or exit points more efficiently.
//+------------------------------------------------------------------+
//|                                                   ADXcrosses.mq4 |
//|                      Copyright © 2004, MetaQuotes Software Corp. |
//|                                        http://www.metaquotes.net |
//+------------------------------------------------------------------+
#property copyright "Copyright © 2004, MetaQuotes Software Corp."
#property link "http://www.metaquotes.net"

#property indicator_chart_window
#property indicator_buffers 2
#property indicator_color1 Blue
#property indicator_color2 Red
//---- input parameters
extern int ADXcrossesPeriod = 14;
//---- buffers
double ExtMapBuffer1[];
double ExtMapBuffer2[];
//----
double b4plusdi, b4minusdi, nowplusdi, nowminusdi;
int    nShift;
//+------------------------------------------------------------------+
//| Custom indicator initialization function                         |
//+------------------------------------------------------------------+
int init()
  {
//---- indicators
    SetIndexStyle(0, DRAW_ARROW, 0, 1);
    SetIndexArrow(0, 233);
    SetIndexBuffer(0, ExtMapBuffer1);
//----
    SetIndexStyle(1, DRAW_ARROW, 0, 1);
    SetIndexArrow(1, 234);
    SetIndexBuffer(1, ExtMapBuffer2);
//---- name for DataWindow and indicator subwindow label
    IndicatorShortName("ADXcrosses(" + ADXcrossesPeriod + ")");
    SetIndexLabel(0, "ADXcrUp");
    SetIndexLabel(1, "ADXcrDn");
//----
    switch(Period())
      {
        case     1: nShift = 1;   break;
        case     5: nShift = 3;   break;
        case    15: nShift = 5;   break;
        case    30: nShift = 10;  break;
        case    60: nShift = 15;  break;
        case   240: nShift = 20;  break;
        case  1440: nShift = 80;  break;
        case 10080: nShift = 100; break;
        case 43200: nShift = 200; break;
      }
//----
    return(0);
  }
//+------------------------------------------------------------------+
//| Custor indicator deinitialization function                       |
//+------------------------------------------------------------------+
int deinit()
  {
//----
    return(0);
  }
//+------------------------------------------------------------------+
//| Custom indicator iteration function                              |
//+------------------------------------------------------------------+
int start()
  {
    int limit;
    int counted_bars = IndicatorCounted();
//---- check for possible errors
    if(counted_bars < 0)
        return(-1);
//---- last counted bar will be recounted
    if(counted_bars > 0)
        counted_bars--;
    limit = Bars - counted_bars;
//----
    for(int i = 0; i < limit; i++)
      {
        b4plusdi = iADX(NULL, 0, ADXcrossesPeriod, PRICE_CLOSE, MODE_PLUSDI, i + 1);
        nowplusdi = iADX(NULL, 0, ADXcrossesPeriod, PRICE_CLOSE, MODE_PLUSDI, i);
        b4minusdi = iADX(NULL, 0, ADXcrossesPeriod, PRICE_CLOSE, MODE_MINUSDI, i + 1);
        nowminusdi = iADX(NULL, 0, ADXcrossesPeriod, PRICE_CLOSE, MODE_MINUSDI, i);
        //----
        if(b4plusdi < b4minusdi && nowplusdi > nowminusdi)
            ExtMapBuffer1[i] = Low[i] - nShift*Point;
        //----
        if(b4plusdi > b4minusdi && nowplusdi < nowminusdi)
            ExtMapBuffer2[i] = High[i] + nShift*Point;
      }
//----
    return(0);
  }
//+------------------------------------------------------------------+
Comments