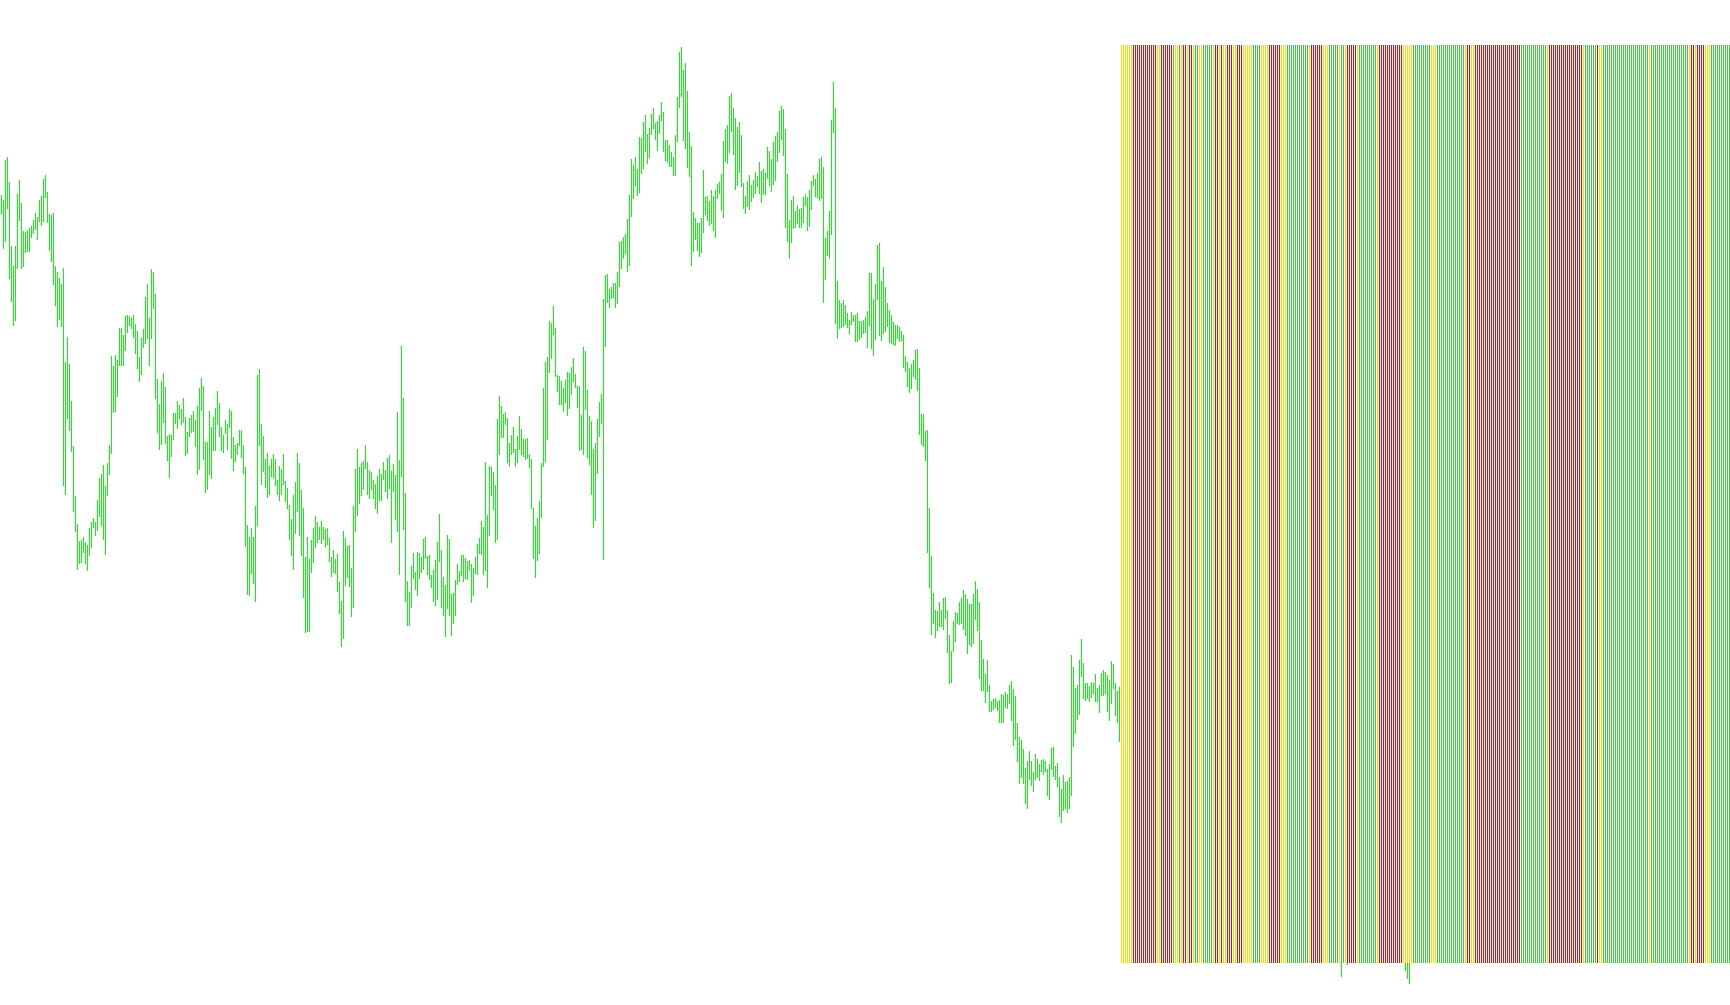
The Flat Trend indicator is designed to provide a visual representation of market momentum and trend direction by combining three different technical analysis tools into a single, easy-to-read display. Instead of cluttering your chart with multiple overlapping lines, this script processes data in the background and presents you with a clear histogram showing whether the market is leaning toward an upward move, a downward move, or staying relatively flat.
How it Works
The logic operates by analyzing historical price data over a specific timeframe (which you can customize, such as 5 minutes, 1 hour, or daily charts). To determine the "trend," the script looks at three specific factors simultaneously:
- Parabolic Sar (Trend Detection): The script uses this to identify the general direction of price movement. It acts as a dynamic boundary; if the price is above this level, it suggests upward momentum, and if below, it suggests downward momentum.
- ADX (Trend Strength): The script compares two different readings of the Average Directional Index (ADX). By looking at these two points in time, it can determine if the strength of a trend is currently increasing or decreasing.
- Price Action: It continuously monitors the current closing price relative to the indicators mentioned above.
Visual Indicators
The tool communicates its findings through three distinct colored bars:
- Lime Green (Bullish Signal): This appears when the Parabolic Sar suggests an upward move and the ADX strength is simultaneously increasing. This is a signal that the market may be gaining "upward" momentum.
- Red (Bearish Signal): This appears when the price drops below the Parabolic Sar and the ADX strength shows a decline in positive movement. This highlights potential "downward" pressure.
- Gold (Neutral/Flat Signal): This serves as a filter. If neither the bullish nor the bearish conditions are met—meaning the market is not showing clear directional momentum—the gold bar appears. This indicates a "flat" trend or a period of consolidation where the price is moving sideways.
Key Features for Users
- Customizable Timeframes: You can set the indicator to scan specific intervals (e.g., M5, H1, D1) to match your trading style.
- Simplified Decision Making: Rather than forcing you to interpret three different complex charts at once, this script distills that data into a single histogram window.
- Clean Visualization: By using separate colors for "Up," "Down," and "Flat," it allows traders to quickly identify periods of high activity versus periods of market indecision.
//+------------------------------------------------------------------+
//|                                                    FlatTrend.mq4 |
//|                                                       Kirk Sloan |
//|                                        http://www.metaquotes.net |
//+------------------------------------------------------------------+
#property copyright "Kirk Sloan"
#property link      "http://www.metaquotes.net"

#property indicator_separate_window
#property indicator_minimum 0
#property indicator_maximum 1
#property indicator_buffers 3
#property indicator_color1 Red
#property indicator_color2 LimeGreen
#property indicator_color3 Gold
//---- input parameters
extern int       Minutes=5;
//---- buffers
double ExtMapBuffer1[];
double ExtMapBuffer2[];
double ExtMapBuffer3[];
double Ma;
double hhigh, llow;
double Psar;
double PADX,NADX;
string TimeFrameStr;
//+------------------------------------------------------------------+
//| Custom indicator initialization function                         |
//+------------------------------------------------------------------+
int init()
  {
//---- indicators
  SetIndexStyle(0,DRAW_HISTOGRAM,STYLE_SOLID,1,Red);
  SetIndexBuffer(0,ExtMapBuffer1);
  SetIndexStyle(1,DRAW_HISTOGRAM,STYLE_SOLID,1, LimeGreen);
  SetIndexBuffer(1,ExtMapBuffer2);
  SetIndexStyle(2,DRAW_HISTOGRAM,STYLE_SOLID,1, Gold);
  SetIndexBuffer(2,ExtMapBuffer3);

switch(Minutes)
   {
      case 1 : TimeFrameStr="Period_M1"; break;
      case 5 : TimeFrameStr="Period_M5"; break;
      case 15 : TimeFrameStr="Period_M15"; break;
      case 30 : TimeFrameStr="Period_M30"; break;
      case 60 : TimeFrameStr="Period_H1"; break;
      case 240 : TimeFrameStr="Period_H4"; break;
      case 1440 : TimeFrameStr="Period_D1"; break;
      case 10080 : TimeFrameStr="Period_W1"; break;
      case 43200 : TimeFrameStr="Period_MN1"; break;
      default : TimeFrameStr="Current Timeframe"; Minutes=0;
   }
   IndicatorShortName("Flat Trend ("+TimeFrameStr+")");


//----
   return(0);
  }
//+------------------------------------------------------------------+
//| Custom indicator deinitialization function                       |
//+------------------------------------------------------------------+
int deinit()
  {
//----

//----
   return(0);
  }
//+------------------------------------------------------------------+
//| Custom indicator iteration function                              |
//+------------------------------------------------------------------+
int start()
  {
   int    counted_bars=IndicatorCounted();
//----

for (int i = 0; i < 300; i++){
   ExtMapBuffer1[i]=0;
   ExtMapBuffer2[i]=0;
   ExtMapBuffer3[i]=0;

   PADX=iADX(NULL,Minutes,14 ,PRICE_CLOSE,1,i);
   NADX=iADX(NULL,Minutes,14 ,PRICE_CLOSE,2,i);

   Psar = iSAR(NULL,Minutes,0.02,0.2,i) ;

   if (Psar < iClose(NULL, Minutes,i) && PADX > NADX){
      ExtMapBuffer2[i] = 1;
      }

   if (Psar > iClose(NULL, Minutes,i) && NADX > PADX){
      ExtMapBuffer1[i] = 1;
         }
   if (ExtMapBuffer1[i] == 0 && ExtMapBuffer2[i] == 0){
      ExtMapBuffer3[i] = 1;
      }

}


//----
   return(0);
  }
//+------------------------------------------------------------------+
Comments