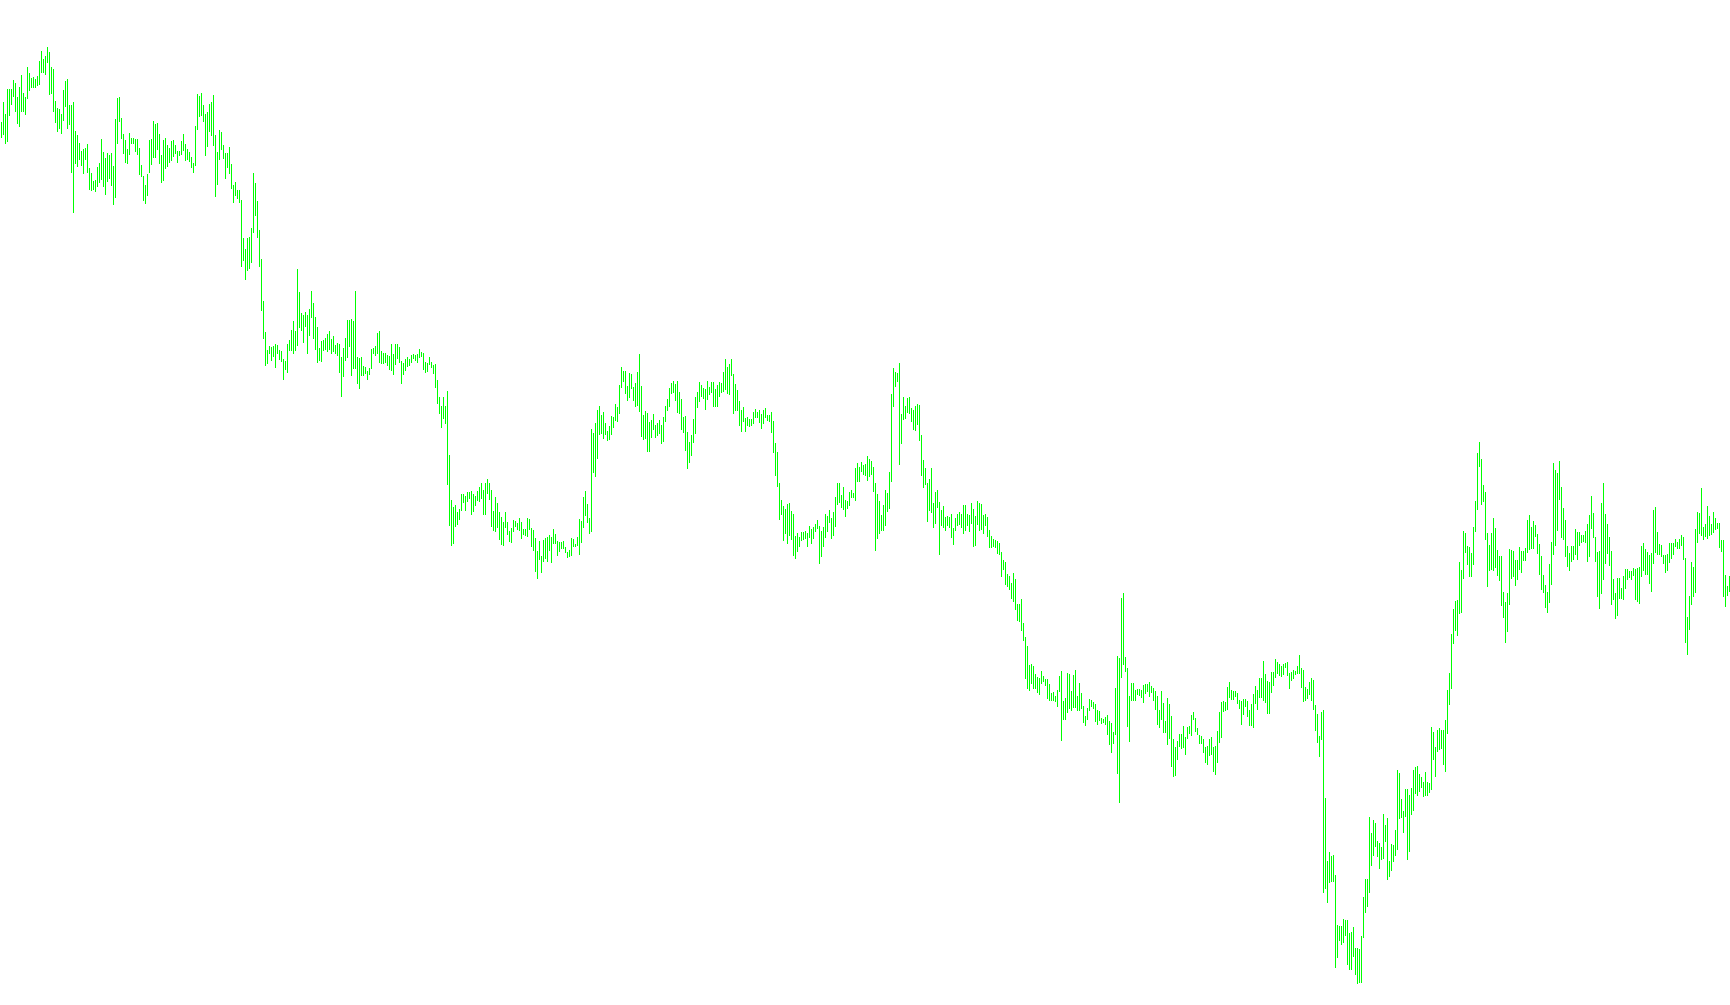
Overview of the SilverTrend Indicator Logic
The SilverTrend script is a technical analysis tool designed to help traders identify potential price trends by calculating specific volatility boundaries on a price chart. Rather than following the price directly, it creates a visual representation of "expected" price zones based on historical highs and lows.
Core Methodology
The logic operates by scanning recent price action—specifically over a user-defined number of previous bars—to identify the highest peak and the lowest valley reached during that period. Once these extremes are identified, the script calculates a range between them to determine the current "momentum" of the market.
Key Components of the Logic
- Dynamic Range Calculation: The tool takes the difference between the highest high and the lowest low of a specific look-back period. It then applies two different percentage-based offsets (defined by the
KminandKmaxparameters) to this range. - Boundary Tracking: By applying these percentages, the script generates two distinct data points:
- A primary boundary representing a "ceiling" or "floor" based on the maximum allowed deviation.
- A secondary boundary used to compare against the primary to detect shifts in direction.
- Trend Identification: The logic compares these two calculated values in real-time. By observing whether the current value exceeds or falls below the previous threshold, the tool attempts to signal a shift in market sentiment.
Visual and On-Screen Feedback
The indicator provides two distinct visual lines (colored Blue and Red) that move across the separate window of the trading platform. These lines represent the mathematical boundaries derived from the price data.
In addition to the visual lines, the script includes an automated commentary system. It monitors the relationship between the current calculated values:
- Buy Signal Logic: If the primary value rises above a specific threshold, the script provides an on-screen notification indicating a potential "buy" opportunity.
- Sell Signal Logic: If the primary value falls below a specific threshold, the script provides an on-screen notification indicating a potential "sell" opportunity.
Summary for the User
Essentially, this tool acts as a volatility filter. It ignores minor price fluctuations and focuses on significant movements relative to recent highs and lows. It translates complex price action into two moving boundaries, alerting the user when the price breaks out of its current "normal" range into a new trend.
//+------------------------------------------------------------------+
//|                                                 SilverTrend .mq4 |
//|                             SilverTrend  rewritten by CrazyChart |
//|                                                 http://viac.ru/  |
//+------------------------------------------------------------------+
#property copyright "SilverTrend  rewritten by CrazyChart"
#property link      "http://viac.ru/ "

#property indicator_separate_window
#property indicator_buffers 2
#property indicator_color1 Blue
#property indicator_color2 Red
//---- input parameters

extern int       CountBars=300;
extern int       SSP=7;
extern double    Kmin=1.6;
extern double    Kmax=50.6; //24 21.6 21.6


//---- buffers
double ExtMapBuffer1[];
double ExtMapBuffer2[];
//+------------------------------------------------------------------+
//| Custom indicator initialization function                         |
//+------------------------------------------------------------------+
int init()
  {
//---- indicators
   IndicatorBuffers(2);
   SetIndexStyle(0,DRAW_LINE,0,2,Blue);
   SetIndexBuffer(0,ExtMapBuffer1);
   SetIndexStyle(1,DRAW_LINE,0,2,Red);
   SetIndexBuffer(1,ExtMapBuffer2);


//----
   return(0);
  }
//+------------------------------------------------------------------+
//| Custor indicator deinitialization function                       |
//+------------------------------------------------------------------+
int deinit()
  {

   return(0);
  }
//+------------------------------------------------------------------+
//| Custom indicator iteration function                              |
//+------------------------------------------------------------------+
int start()
  {

  if (CountBars>=Bars) CountBars=Bars;
   SetIndexDrawBegin(0,Bars-CountBars+SSP);
   SetIndexDrawBegin(1,Bars-CountBars+SSP);
  int i, i2,loopbegin,counted_bars=IndicatorCounted();
  double SsMax, SsMin, K, val1, val2, smin, smax, price;

  if(Bars<=SSP+1) return(0);
  //---- initial zero

//K=33-RISK;

/*
if (firstTime==true)   {
   loopbegin = CountBars;
   if (loopbegin>(Bars-2*SSP+1)) loopbegin=Bars-2*SSP+1;
   firstTime=False;
}; ðóäèìåíò ñòàðîé ïðîãðàììû
*/
  if(Bars<=SSP+1) return(0);
//---- initial zero

//+++++++
if(counted_bars<SSP+1)
   {
      for(i=1;i<=SSP;i++) ExtMapBuffer1[CountBars-i]=0.0;
      for(i=1;i<=SSP;i++) ExtMapBuffer2[CountBars-i]=0.0;
   }
//+++++++-SSP


for(i=CountBars-SSP;i>=0;i--) {


  SsMax = High[Highest(NULL,0,MODE_HIGH,SSP,i-SSP+1)];
  SsMin = Low[Lowest(NULL,0,MODE_LOW,SSP,i-SSP+1)];
   smin = SsMin-(SsMax-SsMin)*Kmin/100;
   smax = SsMax-(SsMax-SsMin)*Kmax/100;
   ExtMapBuffer1[i-SSP+6]=smax;
   ExtMapBuffer2[i-SSP-1]=smax;
   val1 = ExtMapBuffer1[0];
   val2 = ExtMapBuffer2[0];
if (val1 > val2) Comment("ïîêóïêà buy ",val1);

if (val1 < val2) Comment("ïðîäàæà sell ",val2);


}


//----
   return(0);
  }
//+------------------------------------------------------------------+
Comments