ForexOFFTrend2
Download script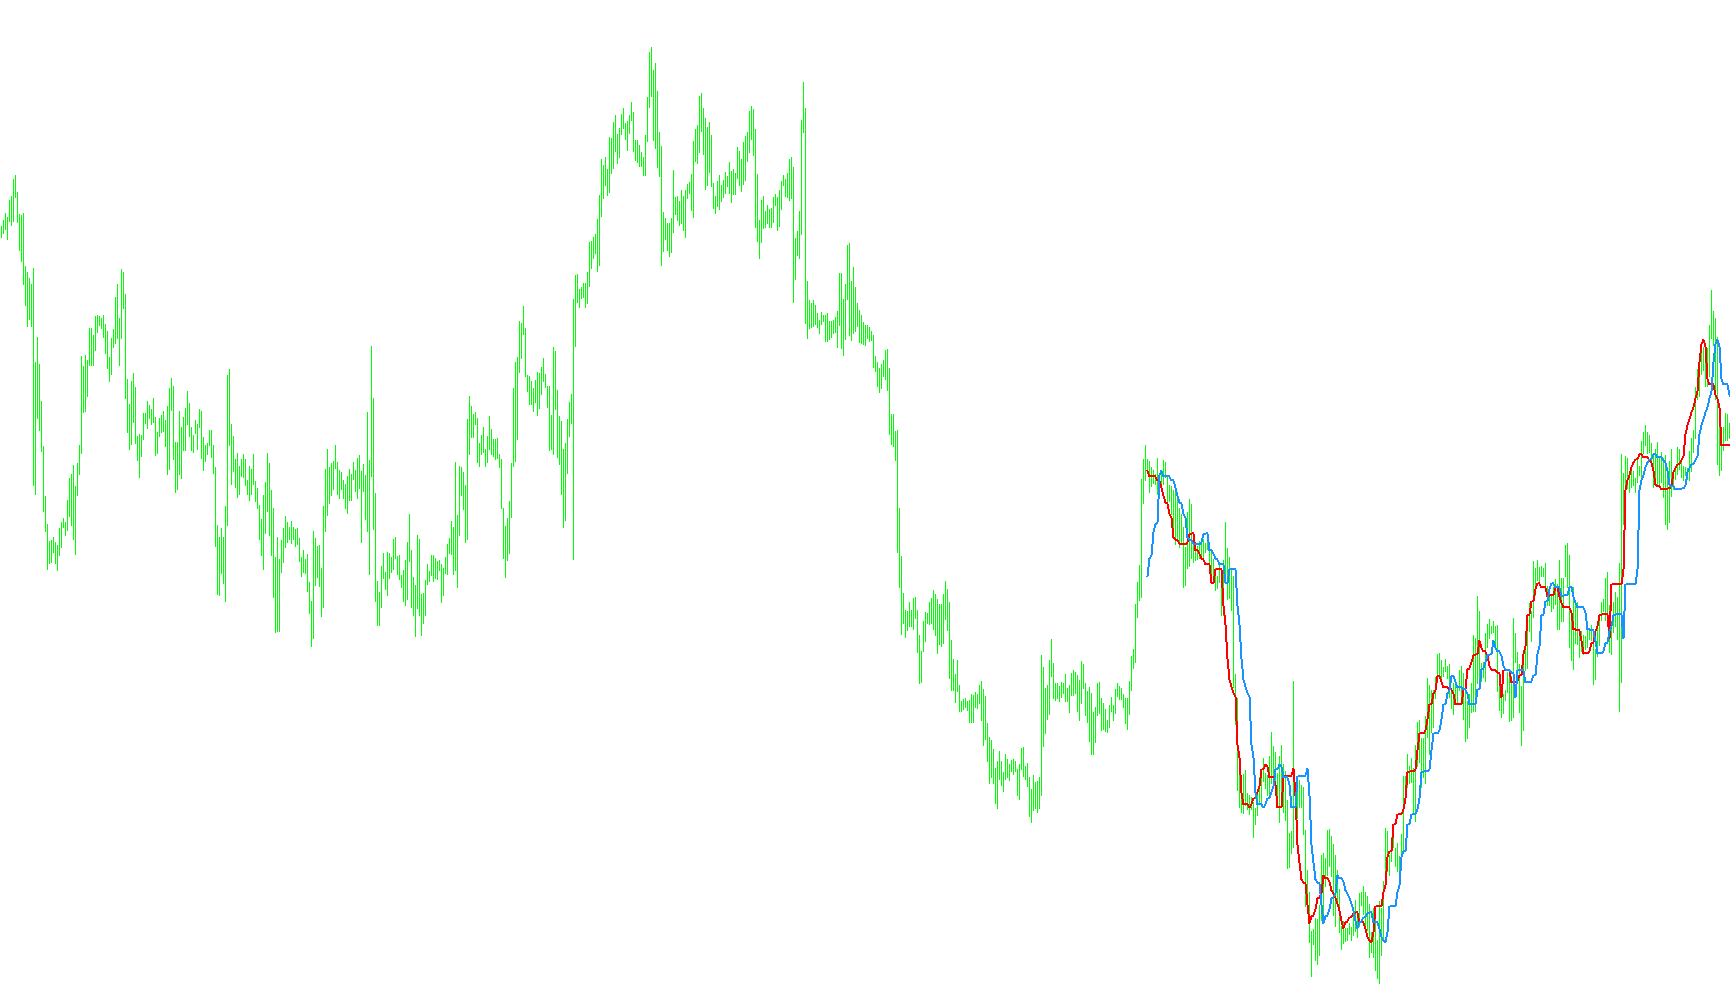
The SilverTrend indicator is a visual trading tool designed to help market observers identify potential trend directions and price momentum by analyzing historical price extremes. Instead of relying on standard moving averages, this script focuses on the relationship between high and low price points over a specific look-back period.
How the Logic Works
1. Data Observation Window The indicator looks at a fixed number of recent price bars (defined by the user) to establish a "neighborhood" of market activity. By focusing on this specific window, the tool ignores distant historical noise and concentrates on current market dynamics.
2. Identifying Extremes For every new price movement, the script scans the specified timeframe to find the highest peak (Highest High) and the lowest valley (Lowest Low). This allows the indicator to understand the current "range" of the market’s volatility.
3. Dynamic Range Calculation Once the highest and lowest points are identified, the logic calculates a specific percentage-based range. It uses two distinct thresholds:
- Minimum Threshold: Derived from a base calculation to find a primary boundary.
- Maximum Threshold: A wider boundary used to project potential price targets or trend limits.
4. Trend Visualization (The Two Lines) The tool plots two separate lines on your chart, represented in Red and DodgerBlue. These lines are essentially "shadows" of the calculated maximum thresholds:
- The Signal Logic: The script compares the values of these two lines relative to each other.
- Buy/Sell Cues: When the first value exceeds the second, it signals a potential bullish (buy) sentiment. Conversely, when the second value exceeds the first, it indicates a potential bearish (sell) sentiment.
Summary for the User
In simple terms, SilverTrend acts as a momentum tracker. It constantly monitors the "ceiling" and "floor" of price action. By plotting these boundaries as lines on your chart and comparing their relative positions, it provides a visual representation of whether the market's strongest momentum is leaning toward the upside or the downside. It helps you see where the "price pressure" is shifting in real-time based on recent highs and lows.
//+------------------------------------------------------------------+
//|                                                 SilverTrend .mq4 |
//|                             SilverTrend  rewritten by CrazyChart |
//|                                                 http://viac.ru/  |
//+------------------------------------------------------------------+
#property copyright "SilverTrend  rewritten by CrazyChart"
#property link      "http://viac.ru/ "

#property indicator_chart_window
#property indicator_buffers 2
#property indicator_color1 Red
#property indicator_color2 DodgerBlue
//---- input parameters

extern int       CountBars=300;
extern int       SSP=7;
extern double    Kmin=1.6;
extern double    Kmax=50.6; //24 21.6 21.6


//---- buffers
double ExtMapBuffer1[];
double ExtMapBuffer2[];
//+------------------------------------------------------------------+
//| Custom indicator initialization function                         |
//+------------------------------------------------------------------+
int init()
  {
//---- indicators
   IndicatorBuffers(2);
   SetIndexStyle(0,DRAW_LINE,0,2,Red);
   SetIndexBuffer(0,ExtMapBuffer1);
   SetIndexStyle(1,DRAW_LINE,0,2,DodgerBlue);
   SetIndexBuffer(1,ExtMapBuffer2);


//----
   return(0);
  }
//+------------------------------------------------------------------+
//| Custor indicator deinitialization function                       |
//+------------------------------------------------------------------+
int deinit()
  {

   return(0);
  }
//+------------------------------------------------------------------+
//| Custom indicator iteration function                              |
//+------------------------------------------------------------------+
int start()
  {

  if (CountBars>=Bars) CountBars=Bars;
   SetIndexDrawBegin(0,Bars-CountBars+SSP);
   SetIndexDrawBegin(1,Bars-CountBars+SSP);
  int i, i2,loopbegin,counted_bars=IndicatorCounted();
  double SsMax, SsMin, K, val1, val2, smin, smax, price;

  if(Bars<=SSP+1) return(0);
  //---- initial zero

//K=33-RISK;

/*
if (firstTime==true)   {
   loopbegin = CountBars;
   if (loopbegin>(Bars-2*SSP+1)) loopbegin=Bars-2*SSP+1;
   firstTime=False;
}; ðóäèìåíò ñòàðîé ïðîãðàììû
*/
  if(Bars<=SSP+1) return(0);
//---- initial zero

//+++++++
if(counted_bars<SSP+1)
   {
      for(i=1;i<=SSP;i++) ExtMapBuffer1[CountBars-i]=0.0;
      for(i=1;i<=SSP;i++) ExtMapBuffer2[CountBars-i]=0.0;
   }
//+++++++-SSP


for(i=CountBars-SSP;i>=0;i--) {


  SsMax = High[Highest(NULL,0,MODE_HIGH,SSP,i-SSP+1)];
  SsMin = Low[Lowest(NULL,0,MODE_LOW,SSP,i-SSP+1)];
   smin = SsMin-(SsMax-SsMin)*Kmin/100;
   smax = SsMax-(SsMax-SsMin)*Kmax/100;
   ExtMapBuffer1[i-SSP+6]=smax;
   ExtMapBuffer2[i-SSP-1]=smax;
   val1 = ExtMapBuffer1[0];
   val2 = ExtMapBuffer2[0];
if (val1 > val2) Comment("ïîêóïêà buy ",val1);

if (val1 < val2) Comment("ïðîäàæà sell ",val2);


}


//----
   return(0);
  }
//+------------------------------------------------------------------+
Comments