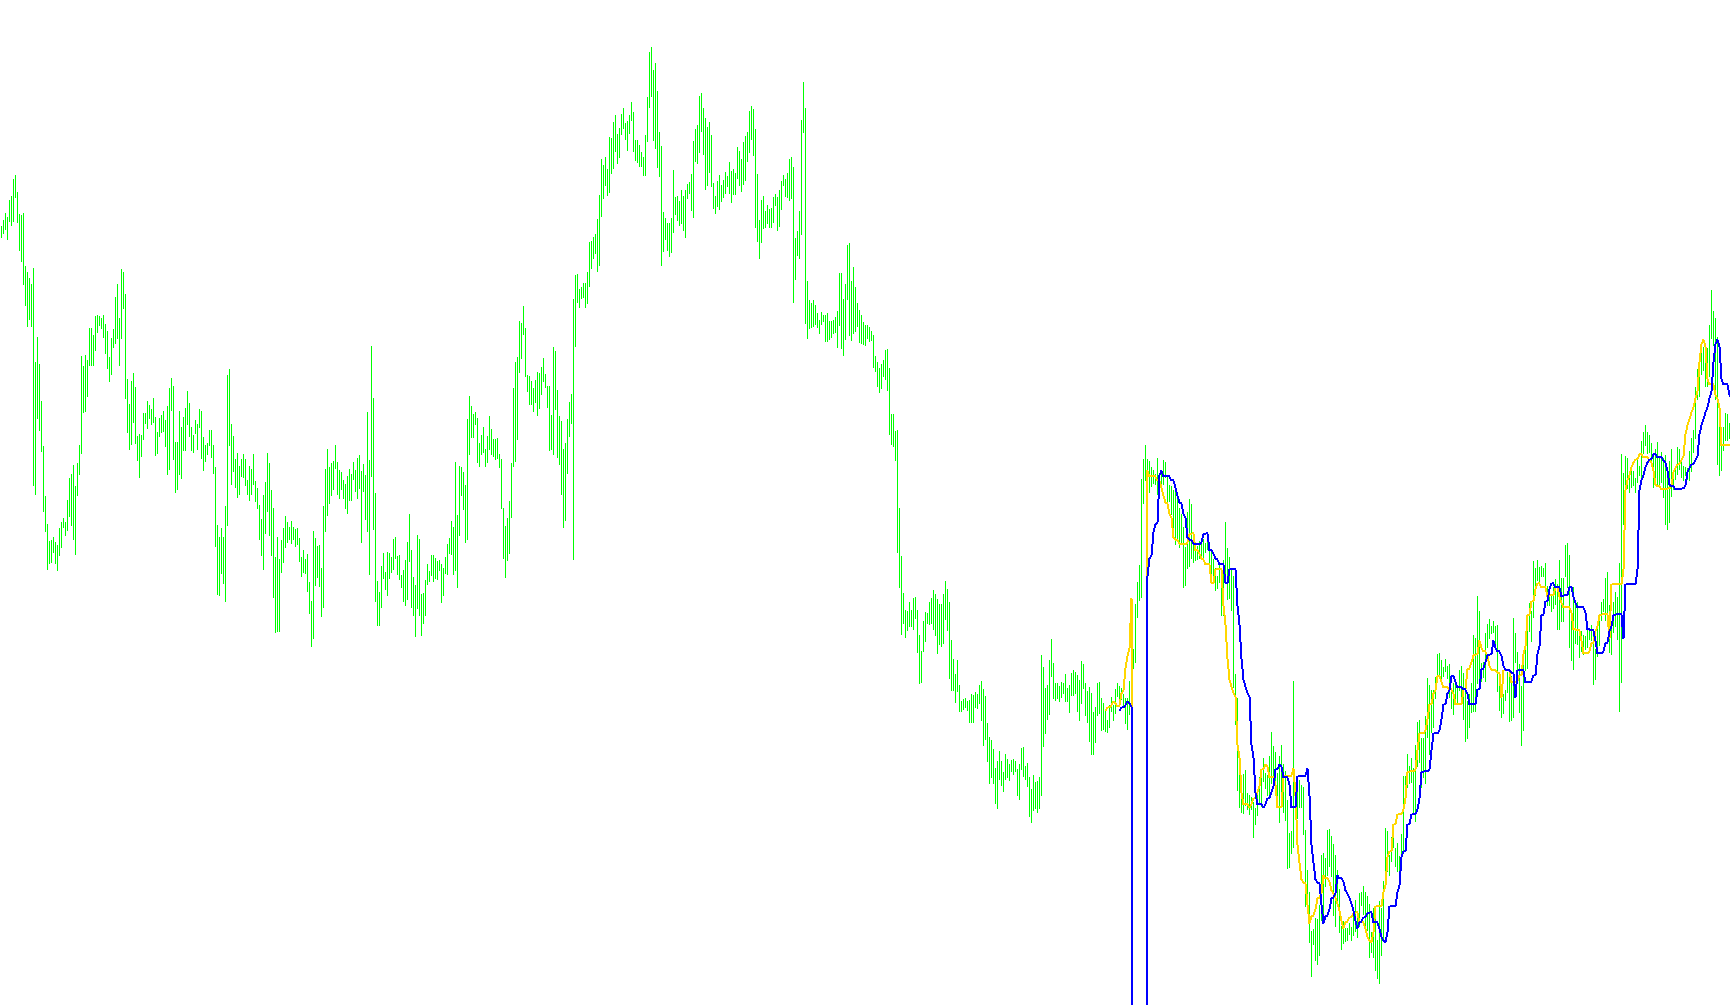
This script is a technical analysis tool designed for the MetaTrader 4 platform to help traders identify potential price trends and reversals. It functions by analyzing historical price action over a specific look-back period to calculate dynamic support and resistance levels.
Core Logic and Mechanism
The tool operates by scanning a set number of previous bars (candles) on the chart to determine the highest and lowest prices reached within that timeframe. Once these extremes are identified, the script calculates a "buffer zone" based on a percentage of the total price range.
Rather than simply marking the absolute peak or valley, the logic creates two distinct price boundaries:
- The Upper Boundary: A calculated value derived from the high point of the recent price action.
- The Lower Boundary: A calculated value derived from the low point of the recent price action.
Visual and Informational Output
As the script processes the data, it generates two distinct lines on the chart. These lines act as visual guides to represent the moving calculation of these boundaries. The primary goal of this visualization is to show the "trend" of the price relative to these boundaries.
To provide immediate clarity for the user, the script includes an automated messaging system:
- Buy Signals: If the calculated upper boundary moves in a specific direction relative to its previous position, a text comment appears on the screen indicating a potential buy opportunity, accompanied by the specific price value.
- Sell Signals: Conversely, if the calculation shifts in the opposite direction, a text comment is displayed on the screen indicating a potential sell opportunity, along with the corresponding price value.
Summary for Traders
In essence, this script filters out "market noise" by looking at the significant highs and lows of a specific window of time. It then projects where the price should be heading based on those extremes, providing the user with real-time text notifications on the chart to help identify when the market might be shifting from one trend to another.
//+------------------------------------------------------------------+
//|                                                ForexOFFTrend.mq4 |
//|                             SilverTrend  rewritten by CrazyChart |
//|                                                 http://viac.ru/  |
//+------------------------------------------------------------------+
#property copyright "SilverTrend  rewritten by CrazyChart"
#property link      "http://viac.ru/ "

#property indicator_chart_window
#property indicator_buffers 2
#property indicator_color1 Red
#property indicator_color2 Blue
//---- input parameters
extern int    CountBars = 300;
extern int    SSP = 7;
extern double Kmin = 1.6;
extern double Kmax = 50.6; //24 21.6 21.6
//---- buffers
double ExtMapBuffer1[];
double ExtMapBuffer2[];
//+------------------------------------------------------------------+
//| Custom indicator initialization function                         |
//+------------------------------------------------------------------+
int init()
  {
   SetIndexStyle(0, DRAW_LINE, 0, 2);
   SetIndexBuffer(0, ExtMapBuffer1);
   SetIndexStyle(1, DRAW_LINE, 0, 2);
   SetIndexBuffer(1, ExtMapBuffer2);
//----
   if(CountBars >= Bars)
       CountBars = Bars;
   SetIndexDrawBegin(0, Bars - CountBars + SSP);
   SetIndexDrawBegin(1, Bars - CountBars + SSP);
//----
   return(0);
  }
//+------------------------------------------------------------------+
//| Custor indicator deinitialization function                       |
//+------------------------------------------------------------------+
int deinit()
  {
   return(0);
  }
//+------------------------------------------------------------------+
//| Custom indicator iteration function                              |
//+------------------------------------------------------------------+
int start()
  {
   int i, i2,loopbegin,counted_bars=IndicatorCounted();
   double SsMax, SsMin, K, val1, val2, smin, smax, price;
//----
   if(Bars <= SSP + 1)
       return(0);
//----
   if(counted_bars < SSP + 1)
     {
       for(i = 1; i <= SSP; i++)
           ExtMapBuffer1[CountBars-i] = 0.0;
       for(i = 1; i <= SSP; i++)
           ExtMapBuffer2[CountBars-i] = 0.0;
     }
   for(i = CountBars - SSP; i >= 0; i--)
     {
       SsMax = High[Highest(NULL, 0, MODE_HIGH, SSP, i - SSP + 1)];
       SsMin = Low[Lowest(NULL, 0, MODE_LOW, SSP, i - SSP + 1)];
       smin = SsMin - (SsMax - SsMin)*Kmin / 100;
       smax = SsMax - (SsMax - SsMin)*Kmax / 100;
       ExtMapBuffer1[i-SSP+6] = smax;
       ExtMapBuffer2[i-SSP-1] = smax;
       val1 = ExtMapBuffer1[0];
       val2 = ExtMapBuffer2[0];
       //----
       if(val1 > val2)
           Comment("ïîêóïêà buy ", val1);
       //----
       if(val1 < val2)
           Comment("ïðîäàæà sell ", val2);
     }
//----
   return(0);
  }
//+------------------------------------------------------------------+
Comments