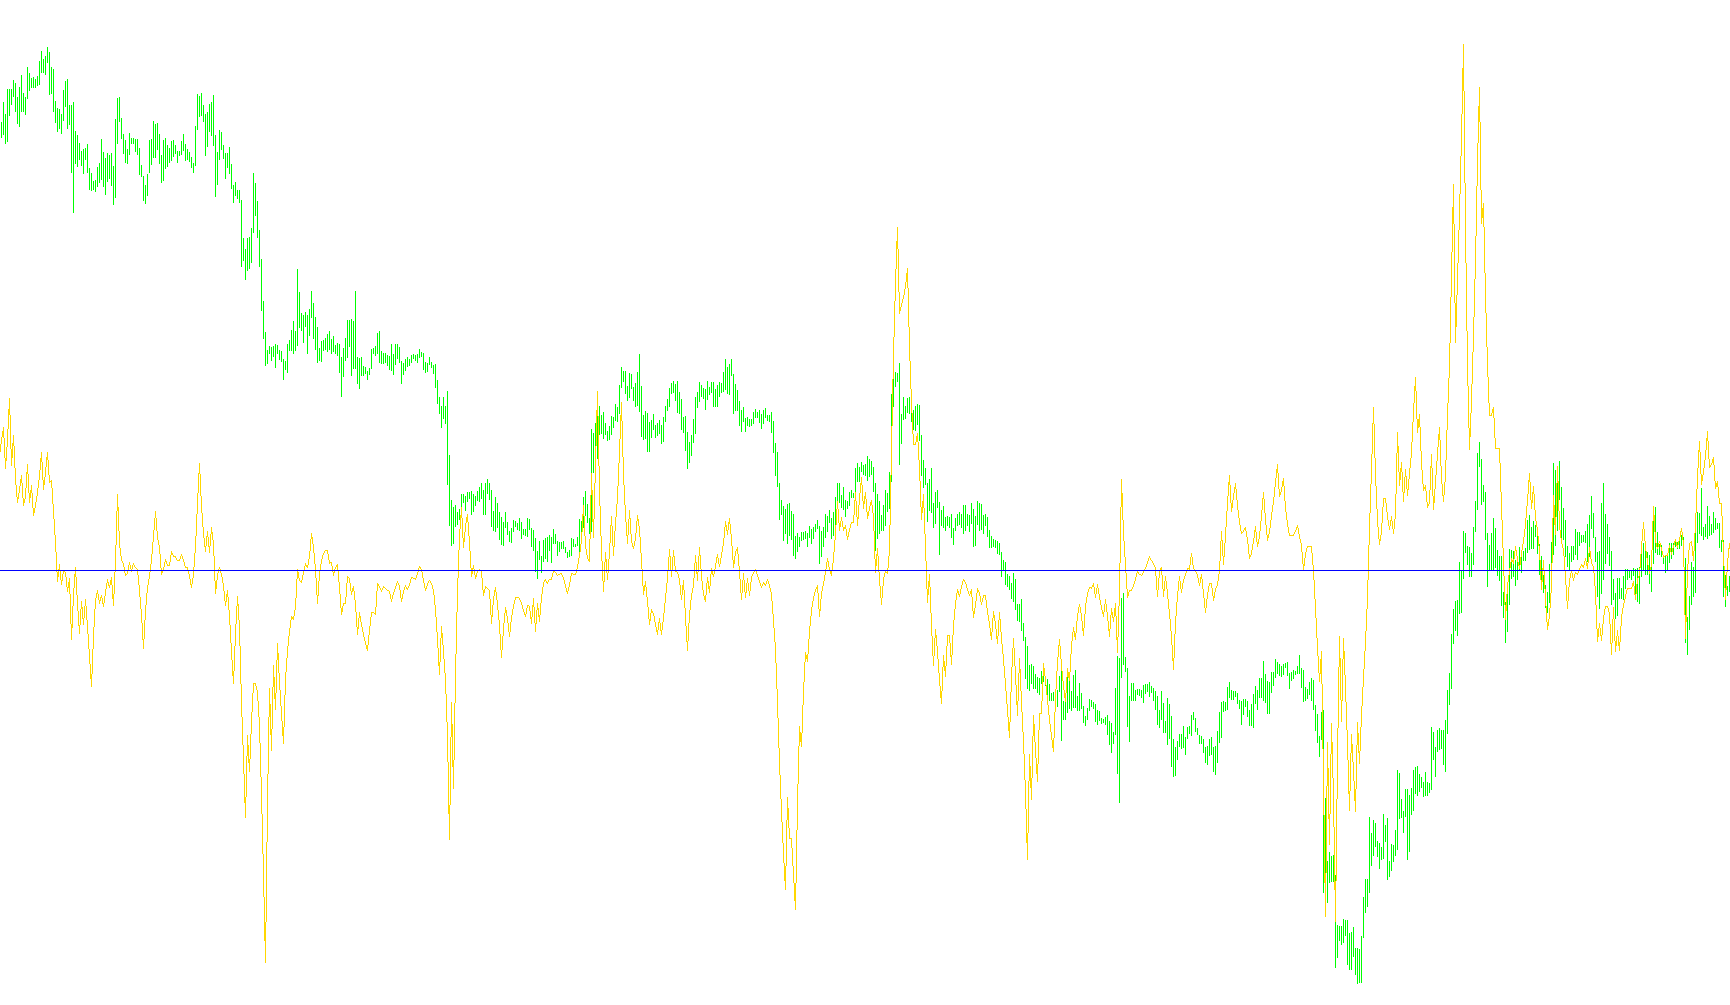
This custom indicator is designed to provide traders with a visual representation of market momentum and price dynamics by calculating two distinct trend lines that react differently to price movements. Unlike standard moving averages, this logic focuses on tracking the "flow" of the market based on specific price conditions.
Core Functionality
The script monitors the relationship between the current closing price and previous prices to determine which direction the market is trending. It manages two primary data streams:
1. Trend Tracking Logic The indicator maintains two separate trend values. These values are not static; they "follow" the price based on whether the price is currently moving upward or downward.
- When the price moves in a consistent direction (e.g., closing higher than the previous candle and staying above a certain threshold), the indicator adjusts its line to follow that movement proportionally.
- The speed at which these lines react is controlled by a sensitivity setting (the "ki" value), which determines how much of the new price change is incorporated into the current trend calculation at each step.
2. Divergence and Spread Calculation The primary purpose of the script is to measure the relationship between these two trend lines.
- One line reacts to specific upward movements, while the other reacts to specific downward movements (or variations thereof).
- By calculating the distance between these two lines, the indicator produces a visual representation of the market's "stretch."
How it behaves on a chart
Instead of appearing directly on the price candles, this indicator opens in a separate window below your main chart. It converts the gap between the two trend lines into a numerical value.
- Expansion: When the gap between the two lines widens significantly, it suggests a strong, sustained trend is occurring in one direction.
- Contraction: When the lines move closer together, it indicates that the momentum is fading or that the market is entering a period of consolidation.
Summary for Traders
Think of this tool as a "tension gauge." It ignores minor price noise and focuses on the broader structural flow of the market. By observing the distance between the blue and red components, traders can visually identify when a trend is becoming overextended or when the market is beginning to lose its directional strength.
#property  copyright "ANG3110@latchess.com"
//--------ang_AZad (C)-------------------
#property indicator_separate_window
#property indicator_buffers 2
#property indicator_color1 Blue
#property indicator_color2 Red
//----------------------
extern double ki=4;
//--------------------
double za[],z,za2[],z2,aza[],a0[];
//********************************************************
int init(){
IndicatorBuffers(4);
SetIndexBuffer(0,aza);
SetIndexBuffer(1,a0);
SetIndexBuffer(2,za);
SetIndexBuffer(3,za2);
return(0);}
//********************************************************
int start() {
int i,cbi;
int n,ai,bi,f,ai2,bi2,f2;
cbi=Bars-IndicatorCounted()-1;
//------------------------------------------------------------------------------------------------------------------------------
for(i=cbi; i>=0; i--) {
if (Close[i]>z && Close[i]>Close[i+1]) z=za[i+1]+(Close[i]-za[i+1])/ki;
if (Close[i]<z && Close[i]<Close[i+1]) z=za[i+1]+(Close[i]-za[i+1])/ki;
if (Close[i]>z2 && Close[i]<Close[i+1]) z2=za2[i+1]+(Close[i]-za2[i+1])/ki;
if (Close[i]<z2 && Close[i]>Close[i+1]) z2=za2[i+1]+(Close[i]-za2[i+1])/ki;
if (i>Bars-5) {z=Close[i]; z2=z;}
za[i]=z;
za2[i]=z2;
aza[i]=(za[i]-za2[i])/Point;
a0[i]=0.00000001;
}
//------------------------------------------------------
   return(0);}
//********************************************************
Comments