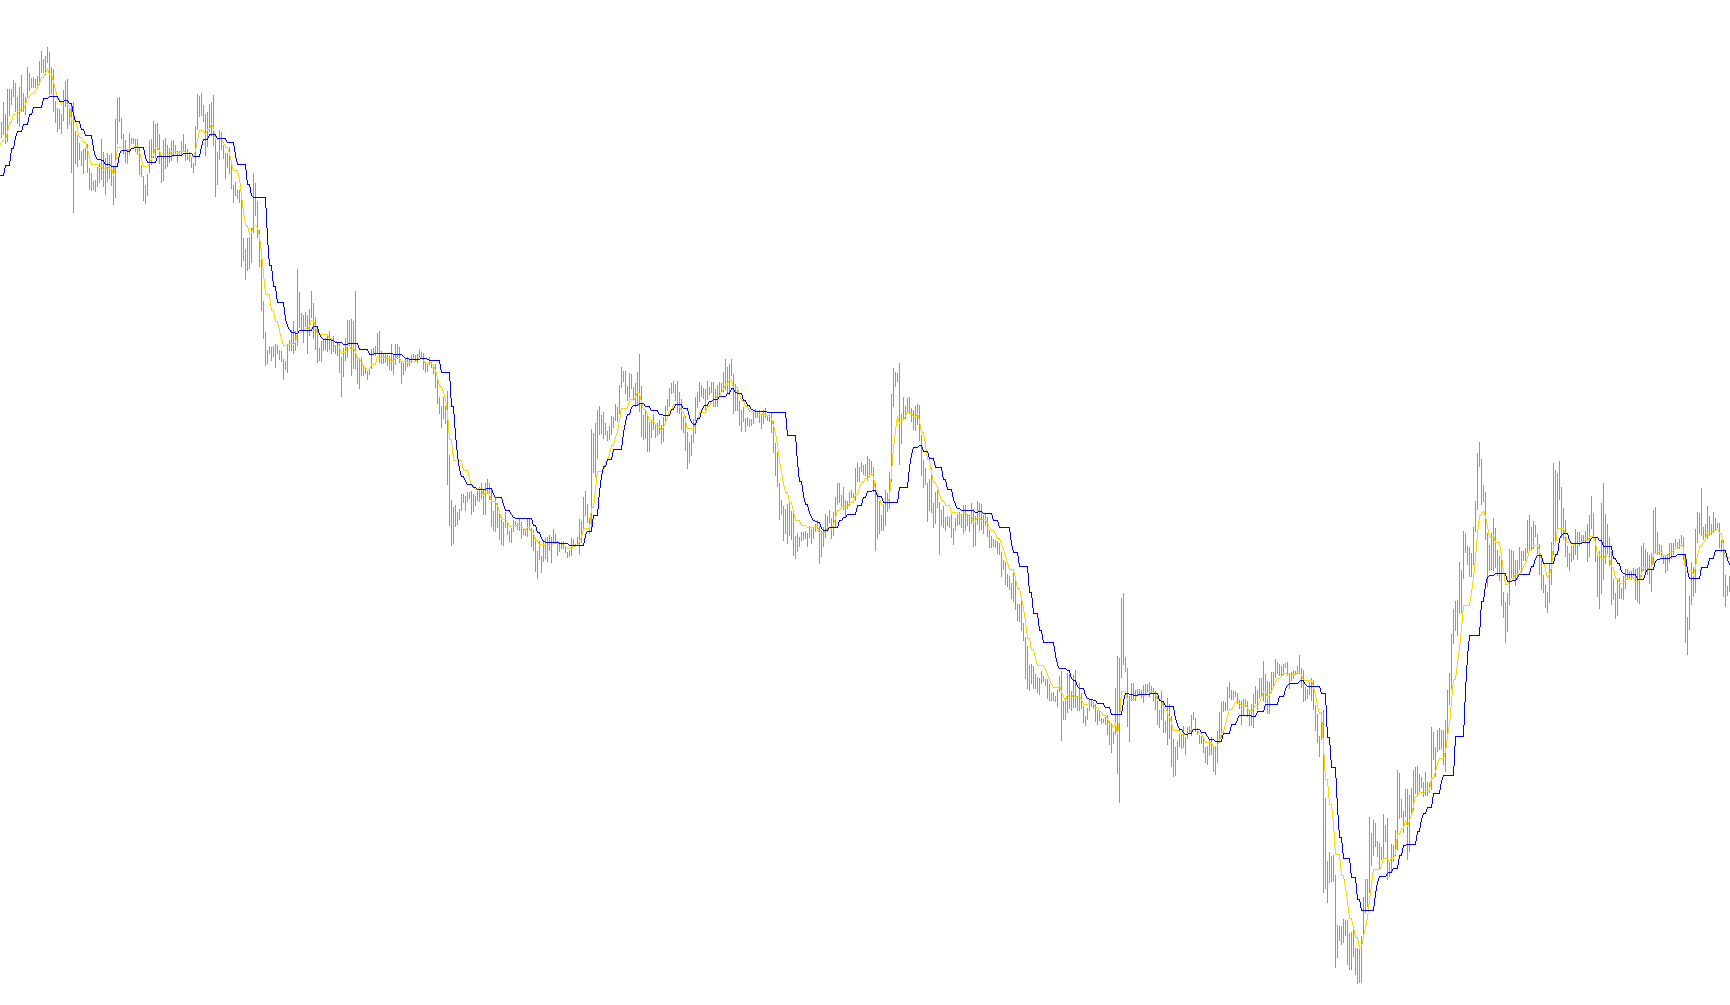
This script is designed to provide a visual representation of price momentum and trend direction directly on your trading chart. Rather than using standard moving averages, it employs a unique logic that reacts dynamically to the relationship between current prices and historical trends.
How the Logic Works
The script tracks two primary data lines: one represented in blue and the other in red. These lines are calculated based on how the market price behaves relative to its immediate previous position and a specific sensitivity factor (the "ki" value).
1. Trend Smoothing and Adjustment The core logic constantly monitors whether the current closing price is moving higher or lower than the previous candle.
- When the price is trending upward, the script calculates a new point by taking the previous trend value and adding a portion of the current price movement.
- When the price is trending downward, it applies a similar calculation to reflect that decrease.
By dividing this movement by a sensitivity constant, the script "smooths" out sudden spikes, helping to visualize the underlying direction of the market without the lag often found in traditional indicators.
2. Dynamic Reaction Points The script differentiates between different types of price action:
- One line reacts specifically to consistent moves (where price and momentum are aligned).
- The second line tracks moments where the price might be attempting to reverse or showing a different type of pressure (where price and previous movement show a divergence).
3. Historical Initialization To ensure the lines appear correctly from the start of the chart, the script performs an initial "handshake" with the data. It looks back at the most recent bars to establish a baseline for the trend, ensuring that the visual lines are anchored accurately to the current market context before they begin moving dynamically with live price updates.
Summary for Traders
Essentially, this tool acts as a "smart" tracker. Instead of just showing you where the price was, it tries to calculate the velocity and direction of the price movement. By looking at the interplay between the blue and red lines, you can better visualize whether the market is maintaining its current momentum or if there is a shift in the underlying trend.
/*-----------------------------+
|			       |
| Shared by www.Aptrafx.com    |
|			       |
+------------------------------*/

#property  copyright "ANG3110@latchess.com"
//--------ang_Zad (C)-------------------
#property indicator_chart_window
#property indicator_buffers 2
#property indicator_color1 Blue
#property indicator_color2 Red
//----------------------
extern double ki=4;
//--------------------
double za[],z,za2[],z2;
//********************************************************
int init(){
SetIndexStyle(0,DRAW_LINE);
SetIndexBuffer(0,za);
SetIndexBuffer(1,za2);
return(0);}
//********************************************************
int start() {
int i,cbi;
int n,ai,bi,f,ai2,bi2,f2;
cbi=Bars-IndicatorCounted()-1;
//------------------------------------------------------------------------------------------------------------------------------
for(i=cbi; i>=0; i--) {
if (Close[i]>z && Close[i]>Close[i+1]) z=za[i+1]+(Close[i]-za[i+1])/ki;
if (Close[i]<z && Close[i]<Close[i+1]) z=za[i+1]+(Close[i]-za[i+1])/ki;
if (Close[i]>z2 && Close[i]<Close[i+1]) z2=za2[i+1]+(Close[i]-za2[i+1])/ki;
if (Close[i]<z2 && Close[i]>Close[i+1]) z2=za2[i+1]+(Close[i]-za2[i+1])/ki;
if (i>Bars-5) {z=Close[i]; z2=z;}
za[i]=z;
za2[i]=z2;
}
//------------------------------------------------------
   return(0);}
//********************************************************
Comments