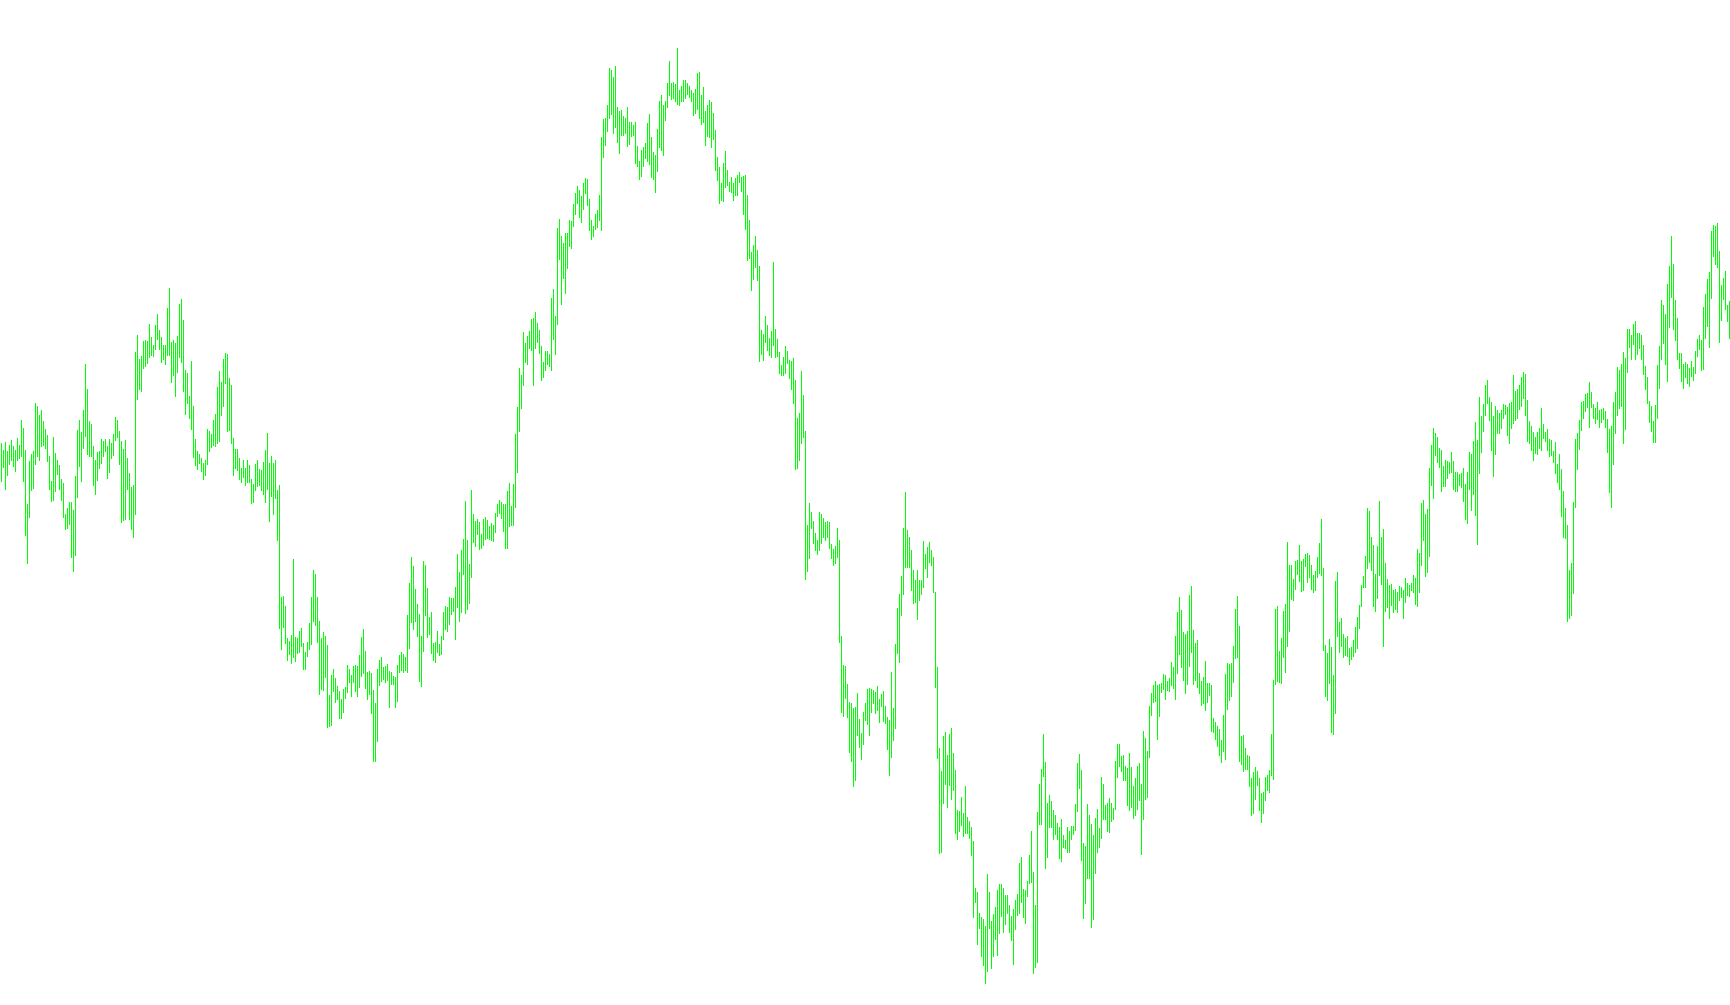
This script is a specialized technical analysis tool designed to track market momentum by measuring the relationship between two different moving averages. It uses a layered calculation method to smooth out price data, making it easier for traders to identify the prevailing direction of the market while filtering out minor "noise."
How the Logic Works
1. Dual-Layer Smoothing (The "EfMA" Process) Unlike standard indicators that calculate a single average from raw price data, this tool applies a two-step smoothing process:
- Step 1: It first calculates a standard Moving Average based on your chosen settings (like SMA, EMA, or LWMA) and specific price types (such as Close, High, or Low).
- Step 2: It then performs a second calculation on those resulting averages to create an "Exponential" version. This double-filtering helps ensure that the trend line is smoother and more representative of the broader market movement rather than sudden, erratic price spikes.
2. Momentum Calculation (The AO Component) The tool compares these two smoothed averages against each other—one representing a "Fast" timeframe and the other a "Slow" timeframe. By subtracting the Slow average from the Fast average, the script generates a momentum value.
- When the result is positive, it suggests upward pressure.
- When the result is negative, it suggests downward pressure.
3. Visual Representation (The Histogram) On your trading chart, this logic is displayed as a histogram:
- Bullish Movement: When the momentum value is rising compared to the previous point, the script highlights this in green.
- Bearish Movement: When the momentum value is falling compared to the previous point, the script highlights this in red.
4. Automated Notifications (Alert System) The script monitors these momentum shifts in real-time and can trigger automated alerts based on specific behavior:
- Zero Crosses: It notifies you when the momentum flips from negative to positive (potentially a buy signal) or positive to negative (potentially a sell signal).
- Trend Reversals: It detects specific "V-shaped" changes in momentum—where the trend starts moving up after a downward move, or vice versa—and sends an alert for these potential turning points.
Summary for the User
Essentially, this tool acts as a sophisticated "trend filter." By smoothing the data twice and then measuring the gap between fast and slow trends, it helps you see where the market is heading with more clarity than standard indicators might provide, while automatically notifying you when the momentum shifts significantly.
//+------------------------------------------------------------------+
//|                                                      AO EfMA.mq4 |
//|            Copyright © 2011 http://www.mql4.com/ru/users/rustein |
//+------------------------------------------------------------------+

//---- Indicator settings
#property  indicator_separate_window
#property  indicator_buffers 3
#property  indicator_color1  Green
#property  indicator_width1  1
#property  indicator_color2  Red
#property  indicator_width2  1
#property  indicator_color3  Gold
#property  indicator_width3  1
//----
//+------------------------------------------------------------------+
extern int  FastPeriod = 13;
//+------------------------------------------------------------------+
extern int  SlowPeriod = 21;
//+------------------------------------------------------------------+
extern int  MAMethod   = 3; // 0=SMA,1=EMA,2=SSMA,3=LWMA
//+------------------------------------------------------------------+
extern int  MAPrice    = 6; // 0=Close,1=Open,2=High,3=Low,4=Median,5=Typical,6=Weighted
//+------------------------------------------------------------------+
extern bool Alerts     = true;
//+------------------------------------------------------------------+
extern int  AlertBar   = 1;
//+------------------------------------------------------------------+
//-------------------------------------------------------------------+

//+------------------------------------------------------------------+
//|            DO NOT MODIFY ANYTHING BELOW THIS LINE!!!             |
//+------------------------------------------------------------------+

//-------------------------------------------------------------------+
//-------------------------------------------------------------------+
//-----
datetime LastAlertTime = -999999;
//---- Buffers
double Bull[];
double Bear[];
double Trend[];
double FastMA[];
double FastEfMA[];
double SlowMA[];
double SlowEfMA[];
//----
int    MAMode;
string strMAType;
int    PriceMA;
string strMAPrice;
//----
//+------------------------------------------------------------------+
//| Custom indicator initialization function                         |
//+------------------------------------------------------------------+
int init()
{
//-----
  switch(MAMethod)
  {
    case 1:  strMAType="EMA";  MAMode=MODE_EMA;  break;
    case 2:  strMAType="SMMA"; MAMode=MODE_SMMA; break;
    case 3:  strMAType="LWMA"; MAMode=MODE_LWMA; break;
    default: strMAType="SMA";  MAMode=MODE_SMA;  break;
  }
//-----
  switch(MAPrice)
  {
    case 1:  strMAPrice="Open";     PriceMA=PRICE_OPEN;     break;
    case 2:  strMAPrice="High";     PriceMA=PRICE_HIGH;     break;
    case 3:  strMAPrice="Low";      PriceMA=PRICE_LOW;      break;
    case 4:  strMAPrice="Median";   PriceMA=PRICE_LOW;      break;
    case 5:  strMAPrice="Typical";  PriceMA=PRICE_TYPICAL;  break;
    case 6:  strMAPrice="Weighted"; PriceMA=PRICE_WEIGHTED; break;
    default: strMAPrice="Close";    PriceMA=PRICE_CLOSE;    break;
  }
//-----
//----- Drawing settings
  IndicatorBuffers(7);
  SetIndexStyle(0,DRAW_HISTOGRAM,STYLE_SOLID,1);
  SetIndexBuffer(0,Bull);
  SetIndexStyle(1,DRAW_HISTOGRAM,STYLE_SOLID,1);
  SetIndexBuffer(1,Bear);
  SetIndexStyle(2,DRAW_NONE,STYLE_SOLID,1);
  SetIndexBuffer(2,Trend);
//------
  SetIndexBuffer(3,FastEfMA);
  SetIndexBuffer(4,FastMA);
  SetIndexBuffer(5,SlowEfMA);
  SetIndexBuffer(6,SlowMA);
  SetIndexDrawBegin(0,FastPeriod);
  SetIndexDrawBegin(1,FastPeriod);
  IndicatorDigits(MarketInfo(Symbol(),MODE_DIGITS)+2);
//----- Name for DataWindow and indicator subwindow label
  IndicatorShortName("AO EfMA ("+FastPeriod+"-"+SlowPeriod+","+strMAType+","+strMAPrice+")");
  SetIndexLabel(0,NULL);
  SetIndexLabel(1,NULL);
//-----
  return(0);
}
//+------------------------------------------------------------------+
int start()
{
  int i,limit;
  int counted_bars=IndicatorCounted();
  if (counted_bars>0) counted_bars--;
  limit=Bars-counted_bars;
//-----
  for(i=limit; i>=0; i--)
  {FastMA[i]=iMA(NULL,0,FastPeriod,0,MAMethod,MAPrice,i);}
//-----
  for(i=limit; i>=0; i--)
  {FastEfMA[i]=iMAOnArray(FastMA,Bars,FastPeriod,0,MAMethod,i);}
//-----
  for(i=limit; i>=0; i--)
  {SlowMA[i]=iMA(NULL,0,SlowPeriod,0,MAMethod,MAPrice,i);}
//-----
  for(i=limit; i>=0; i--)
  {SlowEfMA[i]=iMAOnArray(SlowMA,Bars,SlowPeriod,0,MAMethod,i);}
//-----
  for(i=0; i<limit; i++)
  Trend[i]=FastEfMA[i]-SlowEfMA[i];
//-----
  for(i=limit-1; i>=0; i--)
  {
    double TrendNow=Trend[i];
    double TrendPre=Trend[i+1];
    if(TrendNow > TrendPre)
    {
      Bull[i]=TrendNow;
      Bear[i]=EMPTY_VALUE;
    }
    if(TrendNow < TrendPre)
    {
      Bear[i]=TrendNow;
      Bull[i]=EMPTY_VALUE;
    }
  }
//+------------------------------------------------------------------+
  if(Alerts)
  {
    if(AlertBar >= 0 && Time[0] > LastAlertTime)
    {
      if(Trend[i+AlertBar] > 0 && Trend[i+AlertBar+1] < 0)
      {
        Alert("AO EfMA: Bull Zero Cross! ",Symbol()," TF: ",Period());
      }
      if(Trend[i+AlertBar] < 0 && Trend[i+AlertBar+1] > 0)
      {
        Alert("AO EfMA: Bear Zero Cross! ",Symbol()," TF: ",Period());
      }
//-----
      if(Trend[i+AlertBar] > Trend[i+AlertBar+1] && Trend[i+AlertBar+1] < Trend[i+AlertBar+2])
      {
        Alert("AO EfMA: BULL! ",Symbol()," TF: ",Period());
      }
      if(Trend[i+AlertBar] < Trend[i+AlertBar+1] && Trend[i+AlertBar+1] > Trend[i+AlertBar+2])
      {
        Alert("AO EfMA: BEAR! ",Symbol()," TF: ",Period());
      }
//-----
    }
//-----
    LastAlertTime = Time[0];
  }
//----- Done
  return(0);
}
//+------------------------------------------------------------------+
//|    Copyright © 2011 http://www.mql4.com/ru/users/rustein         |
//+------------------------------------------------------------------+
Comments