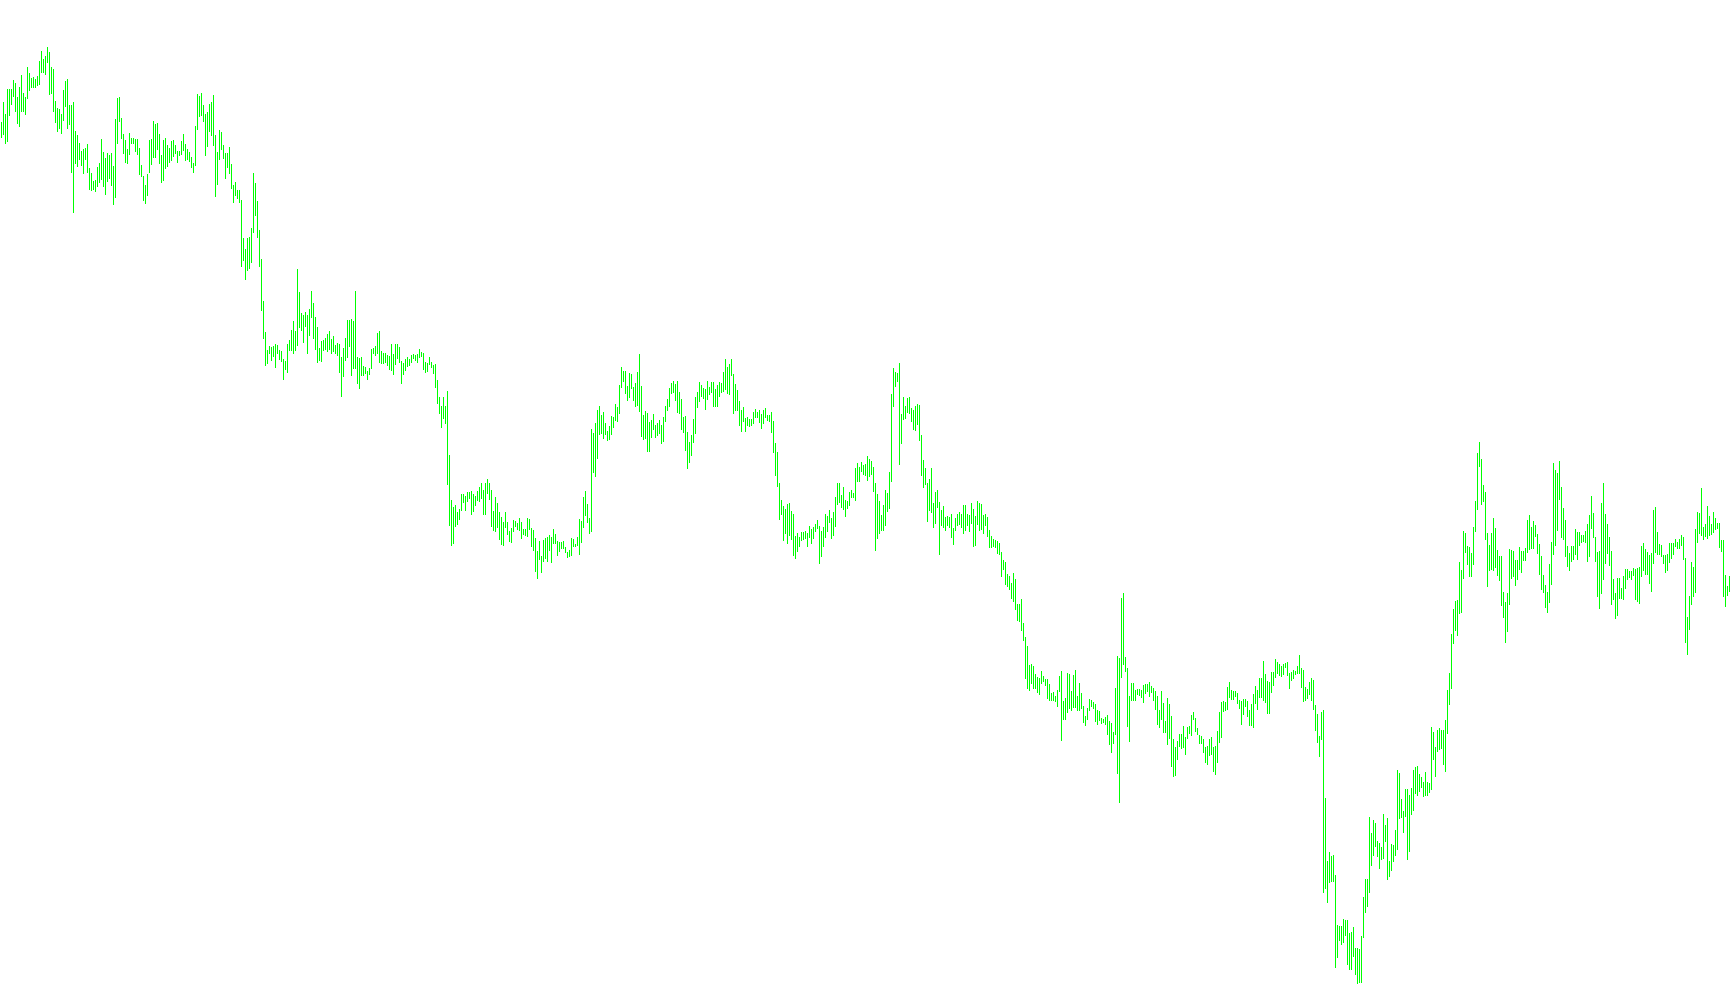
This script is designed as a visual trading tool that identifies potential trend reversals or momentum shifts on a price chart by analyzing historical price volatility and relative strength. Instead of providing a continuous line, it places specific arrow markers to highlight moments where the market's behavior suggests a change in direction.
Core Logic and Methodology
The script operates through a multi-step analytical process to filter out market "noise" and focus on significant movements:
1. Volatility Measurement The tool first examines a rolling window of recent price bars to calculate the average range (the difference between the highs and lows). This allows the script to understand the current "mood" of the market—whether it is moving in large, aggressive swings or small, tight consolidations.
2. Movement Detection It then searches for specific types of price action within that window:
- Gap/Jump Analysis: It looks for significant jumps between the opening and closing prices of consecutive bars.
- Trend Velocity: It evaluates how quickly the price is moving over a set period relative to the average range calculated earlier.
By identifying these specific movements, the script can distinguish between a steady trend and a sudden, explosive change in momentum.
3. Relative Strength Integration The tool incorporates a "Williams Percent Range" (WPR) calculation. This acts as a specialized oscillator that measures whether the price is overextended or underextended relative to its recent highs and lows. The script uses this to determine the strength of the current move, adjusting its internal parameters based on whether it detects a significant trend breakout.
4. Signal Generation (The Arrows) The final output is determined by comparing the current Relative Strength value against specific "Risk" thresholds defined by the user.
- Downside Signals: If the price momentum falls below a certain threshold and then recovers significantly, the script places an arrow above the high of the candle to suggest a potential upward shift.
- Upside Signals: If the price momentum rises above a certain threshold and then retreats significantly, the script places an arrow below the low of the candle to suggest a potential downward shift.
Summary for the User
In essence, this tool acts as a "filter." It ignores minor fluctuations and only triggers a visual signal when it detects a combination of high volatility, specific price gaps, and an overextended relative strength. It aims to provide the trader with clear visual cues on where the market may be reaching a turning point.
//+------------------------------------------------------------------+
//| ASCTrend1sig_noSound.mq4
//| Ramdass - Conversion only
//+------------------------------------------------------------------+

#property indicator_chart_window
#property indicator_buffers 2
#property indicator_color1 Magenta
#property indicator_color2 Aqua

//---- input parameters
extern int RISK=3;
extern int CountBars=300;

//---- buffers
double val1[];
double val2[];


//+------------------------------------------------------------------+
//| Custom indicator initialization function                         |
//+------------------------------------------------------------------+
int init()
  {
//---- indicator line
   IndicatorBuffers(2);
   SetIndexStyle(0,DRAW_ARROW);
   SetIndexArrow(0,108);
   SetIndexStyle(1,DRAW_ARROW);
   SetIndexArrow(1,108);
   SetIndexBuffer(0,val1);
   SetIndexBuffer(1,val2);

//----
   return(0);
  }
//+------------------------------------------------------------------+
//| ASCTrend1sig                                                     |
//+------------------------------------------------------------------+
int start()
  {
   if (CountBars>=1000) CountBars=950;
   SetIndexDrawBegin(0,Bars-CountBars+11+1);
   SetIndexDrawBegin(1,Bars-CountBars+11+1);
   int i,shift,counted_bars=IndicatorCounted();
   int Counter,i1,value10,value11;
   double value1,x1,x2;
   double value2,value3;
   double TrueCount,Range,AvgRange,MRO1,MRO2;
   double Table_value2[1000];

   value10=3+RISK*2;
   x1=67+RISK;
   x2=33-RISK;
   value11=value10;
//----
   if(Bars<=11+1) return(0);
//---- initial zero
   if(counted_bars<11+1)
   {
      for(i=1;i<=0;i++) val1[CountBars-i]=0.0;
      for(i=1;i<=0;i++) val2[CountBars-i]=0.0;
   }
//----
   shift=CountBars-11-1;
   while(shift>=0)
     {

   Counter=shift;
	Range=0.0;
	AvgRange=0.0;
	for (Counter=shift; Counter<=shift+9; Counter++) AvgRange=AvgRange+MathAbs(High[Counter]-Low[Counter]);

	Range=AvgRange/10;
	Counter=shift;
	TrueCount=0;
	while (Counter<shift+9 && TrueCount<1)
		{if (MathAbs(Open[Counter]-Close[Counter+1])>=Range*2.0) TrueCount=TrueCount+1;
		Counter=Counter+1;
		}
	if (TrueCount>=1) {MRO1=Counter;} else {MRO1=-1;}
	Counter=shift;
	TrueCount=0;
	while (Counter<shift+6 && TrueCount<1)
		{if (MathAbs(Close[Counter+3]-Close[Counter])>=Range*4.6) TrueCount=TrueCount+1;
		Counter=Counter+1;
		}
	if (TrueCount>=1) {MRO2=Counter;} else {MRO2=-1;}
	if (MRO1>-1) {value11=3;} else {value11=value10;}
	if (MRO2>-1) {value11=4;} else {value11=value10;}
	value2=100-MathAbs(iWPR(NULL,0,value11,shift)); // PercentR(value11=9)
	Table_value2[shift]=value2;
	val1[shift]=0;
	val2[shift]=0;
	value3=0;
	if (value2<x2)
		{i1=1;
		while (Table_value2[shift+i1]>=x2 && Table_value2[shift+i1]<=x1){i1++;}
		if (Table_value2[shift+i1]>x1)
			{
			value3=High[shift]+Range*0.5;
			val1[shift]=value3;
			}
		}
	if (value2>x1)
		{i1=1;
		while (Table_value2[shift+i1]>=x2 && Table_value2[shift+i1]<=x1){i1++;}
		if (Table_value2[shift+i1]<x2)
			{
			value3=Low[shift]-Range*0.5;
			val2[shift]=value3;
			}
		}

      shift--;
     }

   return(0);
  }
//+------------------------------------------------------------------+
Comments