Execute Linesw Alert_001
Download script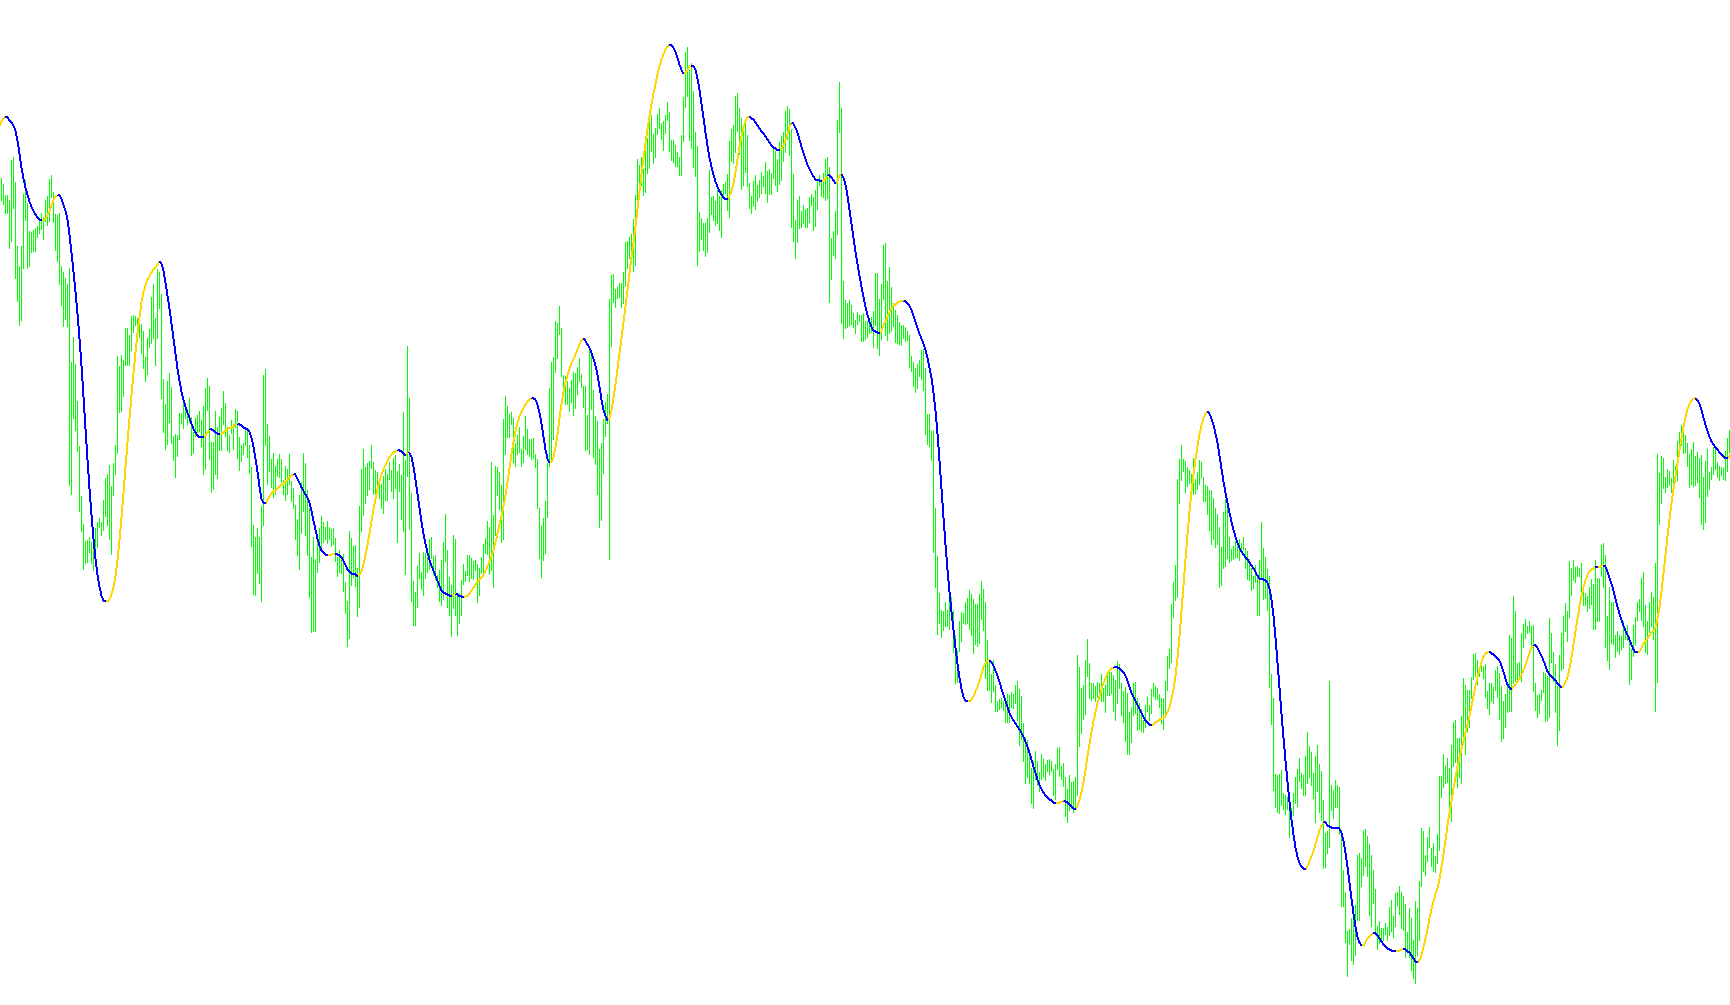
This custom indicator is designed to provide traders with a visual representation of market momentum and trend direction. Instead of simply following price movement, it uses a sophisticated mathematical approach to smooth out market "noise" and identify the underlying primary trend.
Core Logic Overview
The tool operates by processing price data through a multi-stage calculation to determine whether the market is currently in an upward or downward trajectory. It focuses on identifying structural changes rather than minor fluctuations.
How it Works
- Momentum Calculation: The script first calculates a specific "vector" value. It does this by comparing two different moving averages—one based on a standard period and another half as large. By doubling the smaller average and subtracting the larger one, the tool isolates the immediate momentum of the price movement.
- Smoothing & Filtering: To ensure the indicator doesn't react too quickly to minor price spikes (which can lead to "false signals"), it applies a secondary smoothing layer over that momentum vector. This creates a cleaner line that represents the stabilized trend of the market.
- Trend Identification: The script then compares the current value of this smoothed line against its previous value:
- If the value is rising, the logic identifies an Upward Trend.
- If the value is falling, the logic identifies a Downward Trend.
Visual Representation and Alerts
The indicator displays two distinct lines in a separate window below your main price chart:
- Uptrend: Represented by a blue line, this appears when the logic confirms positive momentum.
- Downtrend: Represented by a red line, this appears when the logic confirms negative momentum.
When the script detects a significant shift—specifically when the trend switches from downward to upward (or vice versa)—it triggers an automated alert on your platform. This allows you to react to new trend directions in real-time without having to constantly monitor every minor price tick.
#property indicator_separate_window
#property indicator_buffers 2
#property indicator_color1 Blue
#property indicator_color2 Red
//---- input parameters
extern int       period=40;
int       method=3;                         // MODE_SMA
int       price=0;                          // PRICE_CLOSE
//---- buffers
double Uptrend[];
double Dntrend[];
double ExtMapBuffer[];


//+------------------------------------------------------------------+
//| Custom indicator initialization function                         |
//+------------------------------------------------------------------+
int init()
{
    IndicatorBuffers(3);
    SetIndexBuffer(0, Uptrend);
    //ArraySetAsSeries(Uptrend, true);
    SetIndexBuffer(1, Dntrend);
    //ArraySetAsSeries(Dntrend, true);
    SetIndexBuffer(2, ExtMapBuffer);
    ArraySetAsSeries(ExtMapBuffer, true);

    SetIndexStyle(0,DRAW_LINE,STYLE_SOLID,2);
    SetIndexStyle(1,DRAW_LINE,STYLE_SOLID,2);

    IndicatorShortName("Execute Line("+period+")");
    return(0);
}

//+------------------------------------------------------------------+
//| Custor indicator deinitialization function                       |
//+------------------------------------------------------------------+
int deinit()
{
    // ???? ????? ?????? ??????
    return(0);
}

//+------------------------------------------------------------------+
//| ?????????? ???????                                               |
//+------------------------------------------------------------------+
double WMA(int x, int p)
{
    return(iMA(NULL, 0, p, 0, method, price, x));
}

//+------------------------------------------------------------------+
//| Custom indicator iteration function                              |
//+------------------------------------------------------------------+
int start()
{
    int counted_bars = IndicatorCounted();

    if(counted_bars < 0)
        return(-1);

    int x = 0;
    int p = MathSqrt(period);
    int e = Bars - counted_bars + period + 1;

    double vect[], trend[];

    if(e > Bars)
        e = Bars;

    ArrayResize(vect, e);
    ArraySetAsSeries(vect, true);
    ArrayResize(trend, e);
    ArraySetAsSeries(trend, true);

    for(x = 0; x < e; x++)
    {
        vect[x] = 2*WMA(x, period/2) - WMA(x, period);
 //       Print("Bar date/time: ", TimeToStr(Time[x]), " close: ", Close[x], " vect[", x, "] = ", vect[x], " 2*WMA(p/2) = ", 2*WMA(x, period/2), " WMA(p) = ",  WMA(x, period));
    }

    for(x = 0; x < e-period; x++)

        ExtMapBuffer[x] = iMAOnArray(vect, 0, p, 0, method, x);

    for(x = e-period; x >= 0; x--)
    {
        trend[x] = trend[x+1];
        if (ExtMapBuffer[x]> ExtMapBuffer[x+1]) trend[x] =1;
        if (ExtMapBuffer[x]< ExtMapBuffer[x+1]) trend[x] =-1;

    if (trend[x]>0)
    { Uptrend[x] = ExtMapBuffer[x];
      if (trend[x+1]<0) { Uptrend[x+1]=ExtMapBuffer[x+1]; Alert("Up Trend"); }
      Dntrend[x] = EMPTY_VALUE;
    }
    else
    if (trend[x]<0)
    {
      Dntrend[x] = ExtMapBuffer[x];
      if (trend[x+1]>0) { Dntrend[x+1]=ExtMapBuffer[x+1]; Alert("Down Trend"); }
      Uptrend[x] = EMPTY_VALUE;
    }

    //Print( " trend=",trend[x]);
    }

    return(0);
}
//+------------------------------------------------------------------+
Comments