EJ_Signal
Download script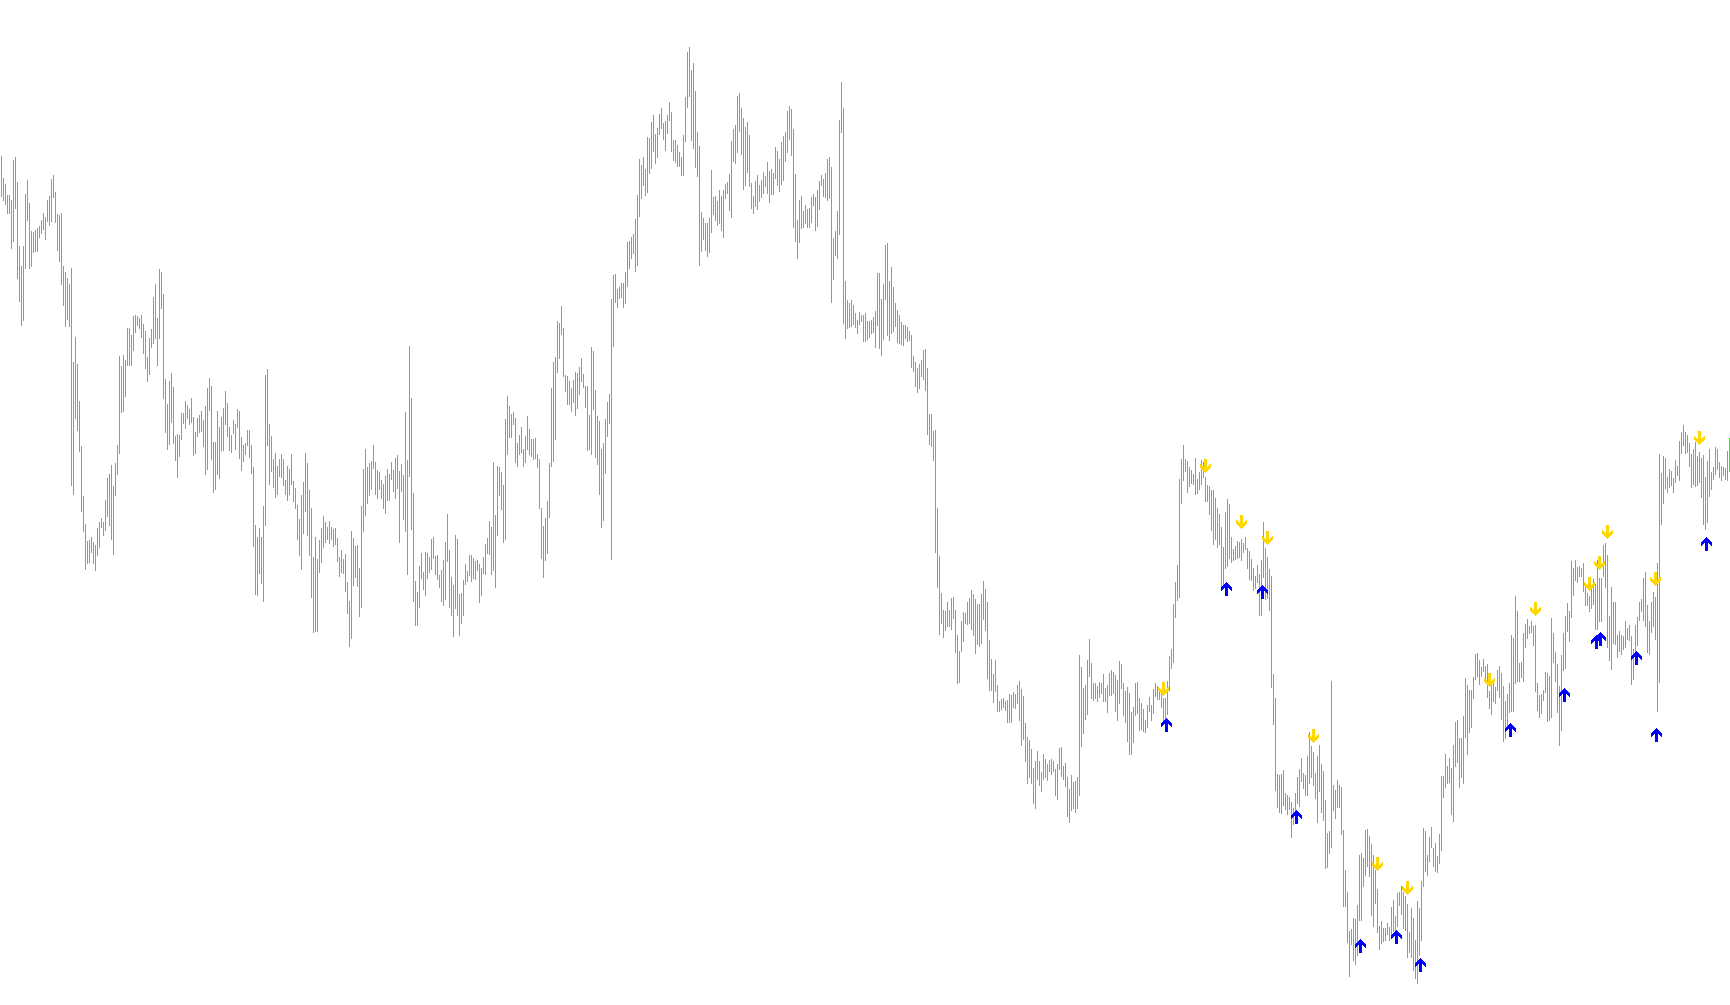
This script is designed to act as a visual signal indicator on your trading chart. Its primary purpose is to identify specific moments in price movement where the trend might be shifting or reaching an extreme point, marking these areas with visual arrows.
How the Logic Works
The script analyzes the market by looking at several layers of data simultaneously:
1. Volatility and Movement Assessment The tool begins by calculating the average range of price movement over a short period. It uses this "average" as a baseline to determine what constitutes a significant move versus normal market noise. By doing this, the script tries to distinguish between minor fluctuations and substantial price action.
2. Trend Intensity Detection To understand the strength of the current trend, the logic looks for two specific types of movements:
- Gap-like Behavior: It checks for large jumps between the opening of one candle and the closing of another relative to the average range.
- Sustained Momentum: It looks for significant price distances covered over a series of candles. Depending on which of these behaviors is detected, the script adjusts its internal sensitivity to better "feel" the current market direction.
3. Momentum Oscillator Integration The script uses a momentum-based calculation (similar to a Williams Percent Range) to determine how far the price has stretched away from its recent average. It essentially measures "overextended" conditions—identifying when the market is pushed very high or very low relative to its recent path.
4. Signal Filtering (The "Safety" Mechanism) One of the most important parts of this logic is how it prevents "false signals." It doesn't just trigger an arrow every time the price hits a limit. Instead, it checks for a specific sequence:
- It looks for the momentum to hit an extreme zone.
- It then scans backward to ensure the price hasn't already behaved erratically in that zone.
- It only places a signal (an arrow) if the price moves from an extreme state back toward a "neutral" zone, suggesting a potential reversal or a completion of a move.
Visual Output
When these conditions are met, the script places two different types of arrows on your chart:
- Upper Signals: Placed above the candles when the logic detects a bearish shift (price moving from an overbought state downward).
- Lower Signals: Placed below the candles when the logic detects a bullish shift (price moving from an oversold state upward).
In summary, this script filters out minor market noise by calculating volatility and momentum, then identifies specific points where the market has reached an exhaustion phase and is likely to turn around.
//+------------------------------------------------------------------+
//| ASCTrend1sig_noSound.mq4
//| Ramdass - Conversion only
//+------------------------------------------------------------------+

#property indicator_chart_window
#property indicator_buffers 2
#property indicator_color1 Magenta
#property indicator_color2 Aqua

//---- input parameters
extern int RISK=3;
extern int CountBars=300;

//---- buffers
double val1[];
double val2[];


//+------------------------------------------------------------------+
//| Custom indicator initialization function                         |
//+------------------------------------------------------------------+
int init()
  {
//---- indicator line
   IndicatorBuffers(2);
   SetIndexStyle(0,DRAW_ARROW);
   SetIndexArrow(0,234);
   SetIndexStyle(1,DRAW_ARROW);
   SetIndexArrow(1,233);
   SetIndexBuffer(0,val1);
   SetIndexBuffer(1,val2);

//----
   return(0);
  }
//+------------------------------------------------------------------+
//| ASCTrend1sig                                                     |
//+------------------------------------------------------------------+
int start()
  {
   if (CountBars>=1000) CountBars=950;
   SetIndexDrawBegin(0,Bars-CountBars+11+1);
   SetIndexDrawBegin(1,Bars-CountBars+11+1);
   int i,shift,counted_bars=IndicatorCounted();
   int Counter,i1,value10,value11;
   double value1,x1,x2;
   double value2,value3;
   double TrueCount,Range,AvgRange,MRO1,MRO2;
   double Table_value2[1000];

   value10=3+RISK*2;
   x1=67+RISK;
   x2=33-RISK;
   value11=value10;
//----
   if(Bars<=11+1) return(0);
//---- initial zero
   if(counted_bars<11+1)
   {
      for(i=1;i<=0;i++) val1[CountBars-i]=0.0;
      for(i=1;i<=0;i++) val2[CountBars-i]=0.0;
   }
//----
   shift=CountBars-11-1;
   while(shift>=0)
     {

   Counter=shift;
	Range=0.0;
	AvgRange=0.0;
	for (Counter=shift; Counter<=shift+9; Counter++) AvgRange=AvgRange+MathAbs(High[Counter]-Low[Counter]);

	Range=AvgRange/10;
	Counter=shift;
	TrueCount=0;
	while (Counter<shift+9 && TrueCount<1)
		{if (MathAbs(Open[Counter]-Close[Counter+1])>=Range*2.0) TrueCount=TrueCount+1;
		Counter=Counter+1;
		}
	if (TrueCount>=1) {MRO1=Counter;} else {MRO1=-1;}
	Counter=shift;
	TrueCount=0;
	while (Counter<shift+6 && TrueCount<1)
		{if (MathAbs(Close[Counter+3]-Close[Counter])>=Range*4.6) TrueCount=TrueCount+1;
		Counter=Counter+1;
		}
	if (TrueCount>=1) {MRO2=Counter;} else {MRO2=-1;}
	if (MRO1>-1) {value11=3;} else {value11=value10;}
	if (MRO2>-1) {value11=4;} else {value11=value10;}
	value2=100-MathAbs(iWPR(NULL,0,value11,shift)); // PercentR(value11=9)
	Table_value2[shift]=value2;
	val1[shift]=0;
	val2[shift]=0;
	value3=0;
	if (value2<x2)
		{i1=1;
		while (Table_value2[shift+i1]>=x2 && Table_value2[shift+i1]<=x1){i1++;}
		if (Table_value2[shift+i1]>x1)
			{
			value3=High[shift]+Range*0.5;
			val1[shift]=value3;
			}
		}
	if (value2>x1)
		{i1=1;
		while (Table_value2[shift+i1]>=x2 && Table_value2[shift+i1]<=x1){i1++;}
		if (Table_value2[shift+i1]<x2)
			{
			value3=Low[shift]-Range*0.5;
			val2[shift]=value3;
			}
		}

      shift--;
     }

   return(0);
  }
//+------------------------------------------------------------------+
Comments