Asctrend3times_MBK
Download script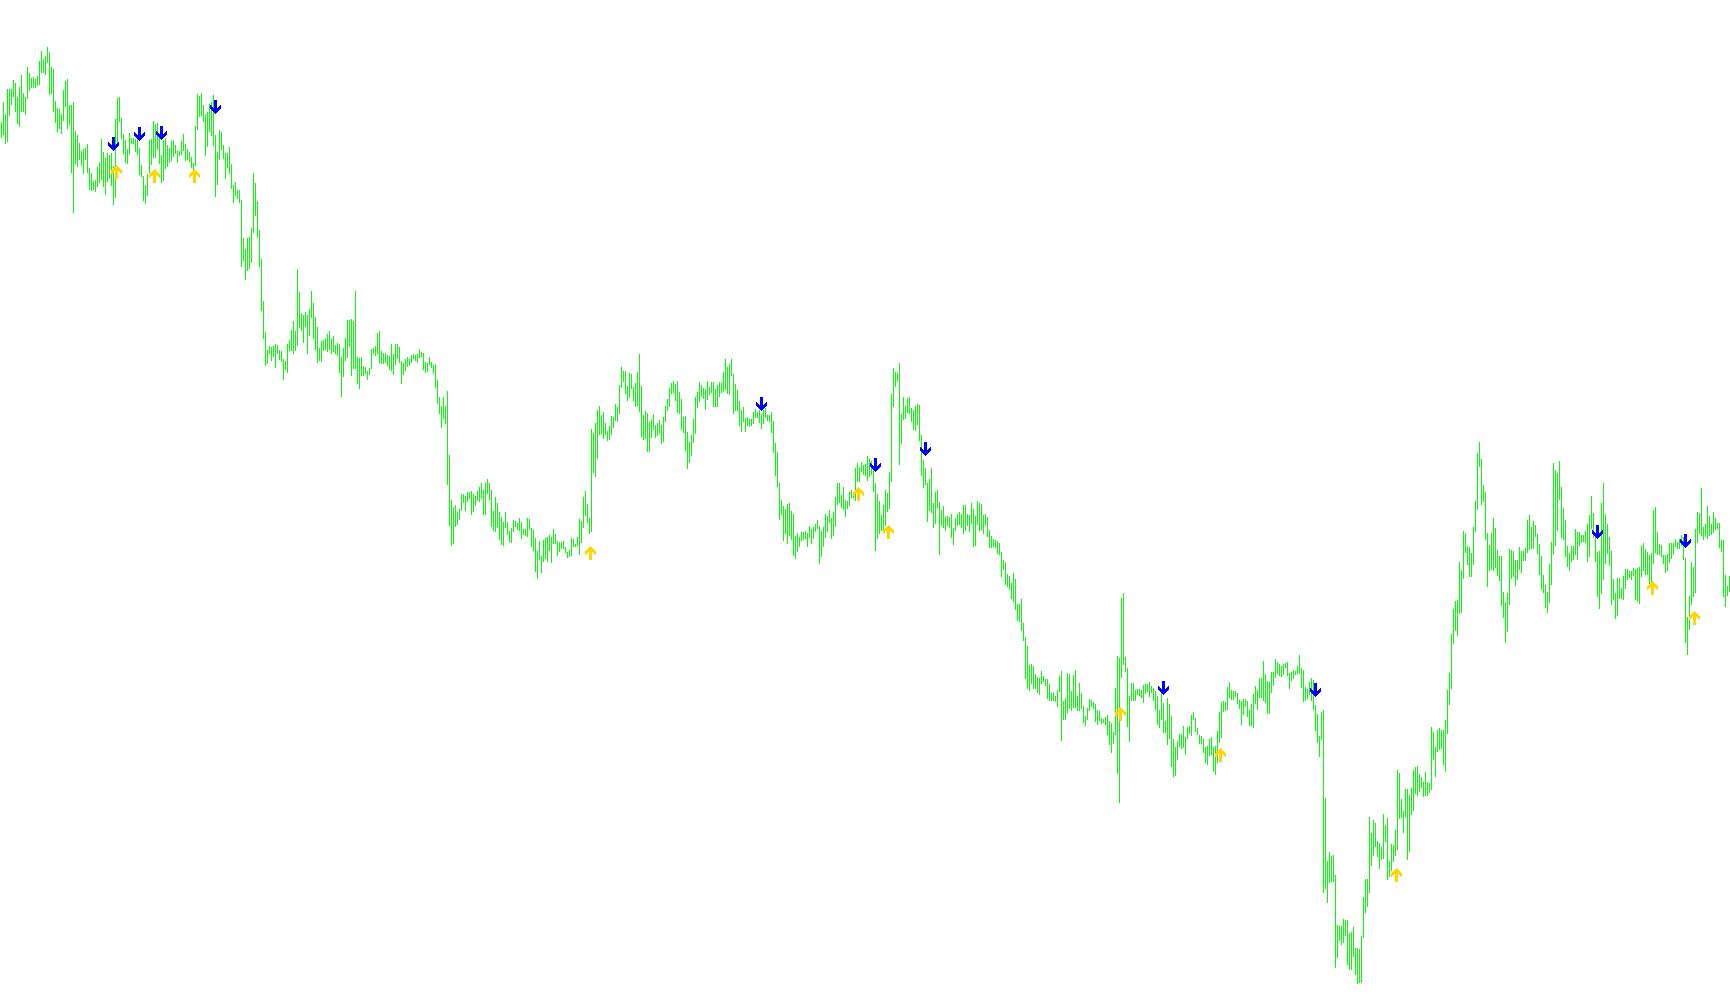
This indicator is designed to identify market trends by analyzing price momentum across three different time horizons simultaneously. Instead of relying on a single data point, it combines multiple perspectives to filter out "noise" and identify more reliable shifts in market direction.
Core Logic & Mechanism
1. Multi-Timeframe Momentum Analysis The tool utilizes a specific technical calculation called the Williams Percent Range (WPR) across three distinct lengths (short, medium, and long). By looking at these three different scales at once, the script can distinguish between a minor price flicker and a significant trend change.
2. Weighted Scoring System Not all timeframes are treated equally. The logic assigns specific "weights" to each of the three momentum values. This means the indicator prioritizes certain timeframes more heavily than others when calculating the final score, ensuring that the signal is balanced between immediate price action and broader market sentiment.
3. Trend Confirmation Filters To decide whether a trend is actually shifting, the script uses a two-step validation process:
- Momentum Score: It calculates a weighted average of the three timeframes.
- Long-Term Anchor: It specifically checks the longest timeframe to ensure that any new trend aligns with the broader market direction.
For example, a "Buy" signal isn't triggered just because short-term momentum is up; the script requires the weighted score to cross a specific high threshold while simultaneously ensuring the long-term anchor remains in an upward position.
4. Dynamic Range Adjustments The indicator calculates the average volatility (the range between highs and lows) of the recent price bars. It uses this calculation to determine exactly where to place its visual markers. This ensures that the signals are placed at a proportional distance from the candles based on how volatile the market is at that moment.
Visual Output & Signals
The script communicates with the user through two specific visual indicators:
- Buy Signals: Represented by a blue arrow appearing below the price candle when the criteria for an upward trend shift are met.
- Sell Signals: Represented by a red arrow appearing above the price candle when the criteria for a downward trend shift are met.
Summary of Operation
In plain terms, this tool acts as a "consensus seeker." It looks at short-term, medium-term, and long-term market momentum, weighs them against each other, and only provides a signal when there is a significant enough move to confirm that the overall trend has officially flipped.
//+------------------------------------------------------------------+
//| MBKAsctrend3times.mq4                                            |
//+------------------------------------------------------------------+
#property copyright "MBKAsctrend3times matt kennel"
#property link      "http://www.metatrader.org"
//----
#property indicator_chart_window
#property indicator_buffers 2
#property indicator_color1 Blue
#property indicator_color2 Red
// Modified by MBK:  now have three different timescales (bar lengths)
// to combine for final WPR indicator, with further long-term trend indicator.
// try on H1 chart with these parameters.
extern int RISK=3;
//extern int CountBars=2000;
extern int NumberofAlerts=0;
extern int WPRLength1=9,WPRLength2=33, WPRLength3=77;
extern int LToffset=-5;
extern double w1=1.0, w2=3.0, w3=1.0; // relative weights
int counter=0;
//---- buffers
double val1[];
double val2[];
//+------------------------------------------------------------------+
//| Custom indicator initialization function                         |
//+------------------------------------------------------------------+
int init()
  {
   string short_name;
//---- indicator line
   IndicatorBuffers(2);
   SetIndexStyle(0,DRAW_ARROW);
   SetIndexArrow(0,233);
   SetIndexStyle(1,DRAW_ARROW);
   SetIndexArrow(1,234);
   SetIndexBuffer(0,val1);
   SetIndexBuffer(1,val2);
//----
   return(0);
  }
//+------------------------------------------------------------------+
//| SilverTrend_Signal                                               |
//+------------------------------------------------------------------+
  int start()
  {
   //if (CountBars>=Bars) CountBars=Bars;
   //SetIndexDrawBegin(0,Bars-CountBars+SSP);
   //SetIndexDrawBegin(1,Bars-CountBars+SSP);
   int i1,i2,K;
   double Range,AvgRange,smin,smax,SsMax,SsMin,price;
   double wprvalue;
   static bool uptrend,old;
   bool flag1, flag2;
   int i,shift,counted_bars=IndicatorCounted();
   //if(Bars<=SSP+1) return(0);
//---- initial zero
   //if(counted_bars<SSP+1)
   // {
   //      for(i=1;i<=SSP;i++) val2[CountBars-i]=0.0;
   //  }
   ////----
   K=33-RISK;
   // wprlength = 3+RISK*2;
   uptrend=false;
   old=false;
   double sumweights=w1+w2+w3;
   w1/=sumweights;
   w2/=sumweights;
   w3/=sumweights;
   int SSP=10;
     for(shift=Bars-SSP; shift>=0; shift--)
     {
      Range=0;
      AvgRange=0;
      for(i1=shift; i1<=shift+SSP; i1++)
        {AvgRange=AvgRange+MathAbs(High[i1]-Low[i1]);
        }
      Range=AvgRange/(SSP+1);
      double wprval1=(100-MathAbs(iWPR(Symbol(),Period(),WPRLength1,shift)));
      double wprval2=(100-MathAbs(iWPR(Symbol(),Period(),WPRLength2,shift)));
      double wprval3=(100-MathAbs(iWPR(Symbol(),Period(),WPRLength3,shift)));
      wprvalue=w1*wprval1 + w2*wprval2 + w3*wprval3;
      //  MathPow(wprval1*wprval2*wprval3,1.0/3.0);
      double wprlong=wprval3;
        if ((wprvalue < 33-RISK) && (wprlong < 50-LToffset))
        {
         uptrend=false;
        }
        if ((wprvalue > 67+RISK) && (wprlong>=50+LToffset))
        {
         uptrend=true;
        }
        if (uptrend!=old && uptrend==true)
        {
         val1[shift]=Low[shift]-Range*0.8; // lower range
         counter=0;
           if (shift==0 && counter<=NumberofAlerts)
           {
            // Alert("MBKAsctrend ",Period()," ",Symbol()," BUY");
            counter=counter+1;
           }
        }
        if (uptrend!=old && uptrend==false)
        {
         counter=0;
         val2[shift]=High[shift]+Range*0.8;
           if (shift==0 && counter<=NumberofAlerts)
           {
            // Alert("Silver Trend ",Period()," ",Symbol()," SELL");
            counter=counter+1;
           }
        }
      Comment(shift);
      old=uptrend;
     }
   return(0);
  }
//+------------------------------------------------------------------+
Comments