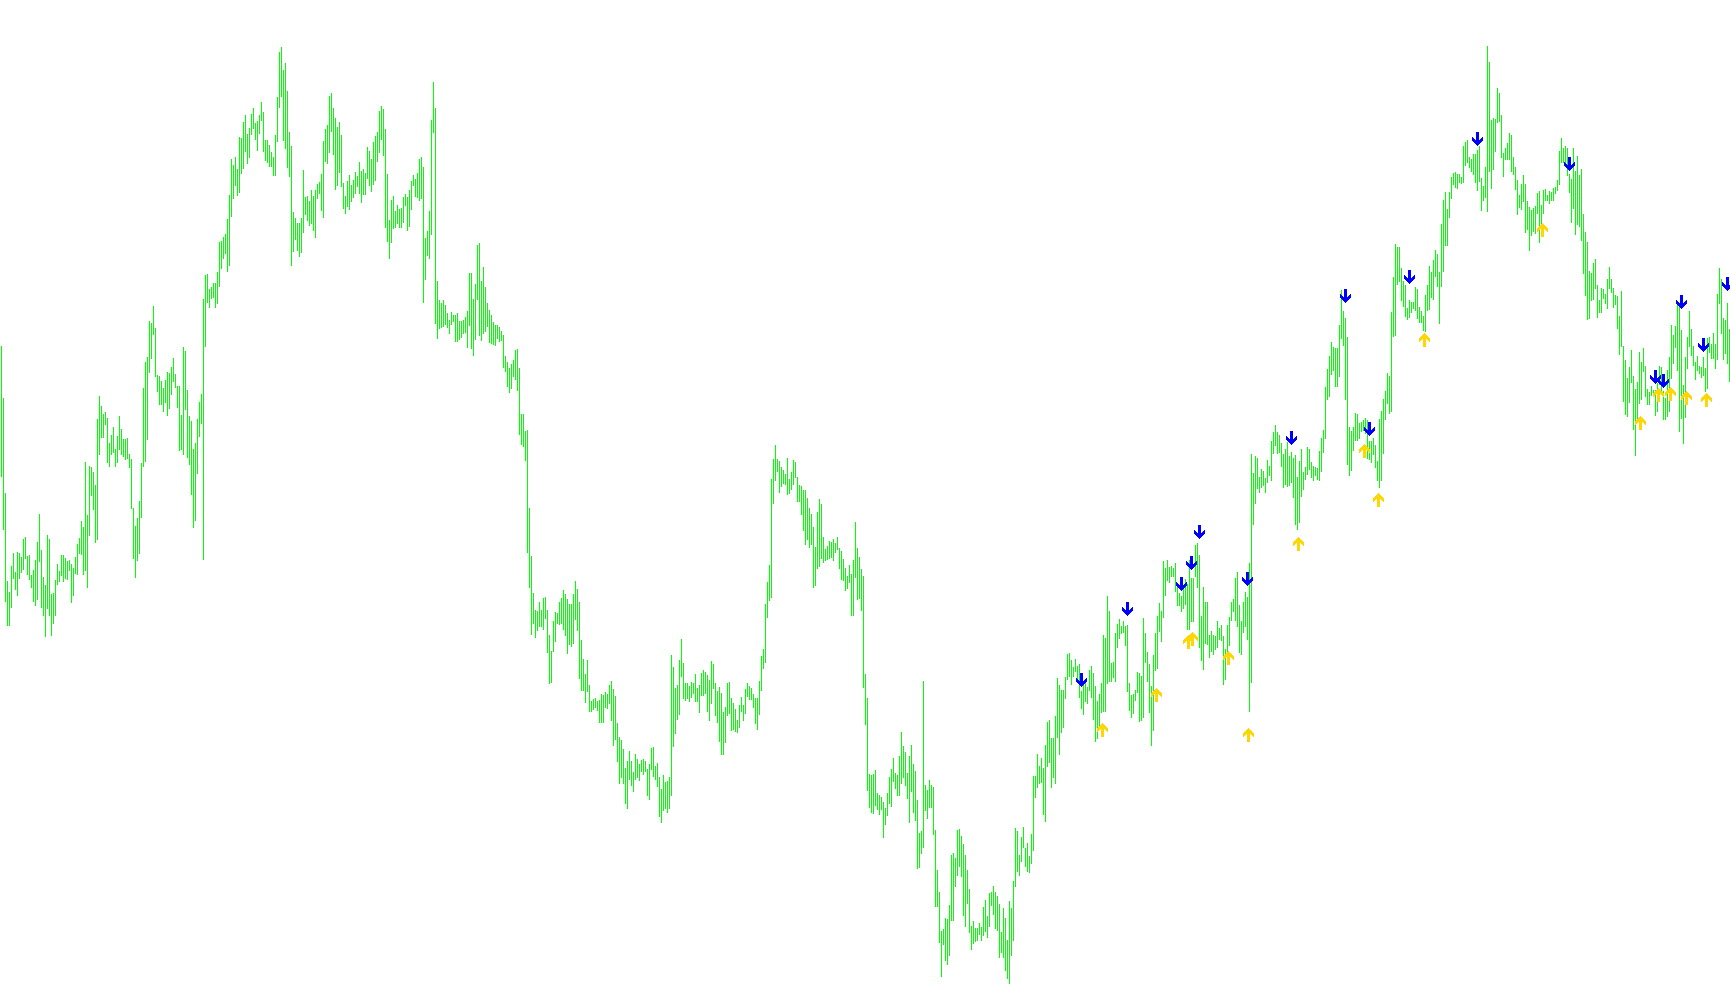
This script is a specialized technical analysis tool designed to identify and signal trend reversals in financial markets. It functions by analyzing price action over a specific historical window to determine when the momentum of the market shifts from bullish (upward) to bearish (downward), or vice versa.
Core Logic and Mechanics
Market Range Analysis The script begins by calculating the "Average Range" of price movements over a set number of previous bars. By measuring the distance between the highest highs and lowest lows during this period, it establishes a baseline for the market's recent volatility. This ensures that the signals generated are relative to how much the price is actually moving in current conditions.
Dynamic Threshold Calculation Instead of using fixed price levels, the script creates dynamic "boundaries" based on a risk percentage. It identifies the highest and lowest points reached within a specific lookback period and calculates two specific thresholds:
- A Lower Boundary: Derived from the minimum price reached.
- An Upper Boundary: Derived from the maximum price reached.
Trend Detection The script constantly monitors where the current closing price sits in relation to these dynamic boundaries. It looks for "breakouts":
- Bullish Trend: If the price closes above the calculated upper boundary, the script identifies a shift into an upward trend.
- Bearish Trend: If the price closes below the calculated lower boundary, the script identifies a shift into a downward trend.
Signal Generation and Alerts The tool is programmed to trigger a visual signal only at the exact moment the trend changes (e.g., moving from a bearish state to a bullish state for the first time). When these conditions are met:
- Visual Markers: It places specific icons on the chart (DodgerBlue for Buy signals and Magenta for Sell signals) positioned slightly above or below the price candle to maintain clarity.
- Real-Time Notifications: If a trend change occurs on the most recent live candle, the script triggers an audible alert and a pop-up notification on your platform. It includes a customizable limit to manage how many alerts are sent to prevent unnecessary notifications during high-volatility periods.
Summary for Traders
Essentially, this tool filters out "market noise" by looking at the broader range of recent price action. It seeks to confirm that a price move is significant enough to constitute a trend change rather than just a minor fluctuation. By providing clear Buy and Sell markers based on these calculated boundaries, it helps traders identify potential entry points where momentum has officially shifted in a new direction.
/*-----------------------------+
|			       |
| Shared by www.Aptrafx.com    |
|			       |
+------------------------------*/

//+------------------------------------------------------------------+
//| SilverTrend_Signal.mq4
//| Ramdass - Conversion only
//+------------------------------------------------------------------+
#property copyright "SilverTrend  rewritten by CrazyChart"
#property link      "http://viac.ru/"

#property indicator_chart_window
#property indicator_buffers 2
#property indicator_color1 DodgerBlue
#property indicator_color2 Magenta

//---- input parameters
extern int RISK=3;
extern int CountBars=350;
extern int NumberofAlerts=2;
int SSP=9;
int counter=0;
//---- buffers
double val1[];
double val2[];

//+------------------------------------------------------------------+
//| Custom indicator initialization function                         |
//+------------------------------------------------------------------+
int init()
  {
   string short_name;
//---- indicator line
   IndicatorBuffers(2);
   SetIndexStyle(0,DRAW_ARROW);
   SetIndexArrow(0,233);
   SetIndexStyle(1,DRAW_ARROW);
   SetIndexArrow(1,234);
   SetIndexBuffer(0,val1);
   SetIndexBuffer(1,val2);
//----
   return(0);
  }
//+------------------------------------------------------------------+
//| SilverTrend_Signal                                               |
//+------------------------------------------------------------------+
int start()
  {
   if (CountBars>=Bars) CountBars=Bars;
   SetIndexDrawBegin(0,Bars-CountBars+SSP);
   SetIndexDrawBegin(1,Bars-CountBars+SSP);
   int i,shift,counted_bars=IndicatorCounted();
   int i1,i2,K;
   double Range,AvgRange,smin,smax,SsMax,SsMin,price;
   bool uptrend,old;
//----

   if(Bars<=SSP+1) return(0);
//---- initial zero
   if(counted_bars<SSP+1)
   {
      for(i=1;i<=SSP;i++) val1[CountBars-i]=0.0;
      for(i=1;i<=SSP;i++) val2[CountBars-i]=0.0;
   }
//----

K=33-RISK;
for (shift = CountBars-SSP; shift>=0; shift--)
{

	Range=0;
	AvgRange=0;
	for (i1=shift; i1<=shift+SSP; i1++)
		{AvgRange=AvgRange+MathAbs(High[i1]-Low[i1]);
		}
	Range=AvgRange/(SSP+1);

SsMax=High[shift]; SsMin=Low[shift];
   for (i2=shift;i2<=shift+SSP-1;i2++)
        {
         price=High[i2];
         if(SsMax<price) SsMax=price;
         price=Low[i2];
         if(SsMin>=price)  SsMin=price;
        }

smin = SsMin+(SsMax-SsMin)*K/100;
smax = SsMax-(SsMax-SsMin)*K/100;
	val1[shift]=0;
	val2[shift]=0;
	if (Close[shift]<smin)
		{
		uptrend = false;
		}
	if (Close[shift]>smax)
		{
		uptrend = true;
		}
   if (uptrend!=old && uptrend==true)
   {
   val1[shift]=Low[shift]-Range*0.5;
   counter=0;
   if (shift==0 && counter<=NumberofAlerts)
   {
   Alert("Silver Trend ",Period()," ",Symbol()," BUY");
   counter=counter+1;
   }
   }
   if (uptrend!=old && uptrend==false)
   {
   counter=0;
   val2[shift]=High[shift]+Range*0.5;
   if (shift==0 && counter<=NumberofAlerts)
   {
   Alert("Silver Trend ",Period()," ",Symbol()," SELL");
   counter=counter+1;

   }
   }
   Comment(shift);
   old=uptrend;

}
   return(0);
  }
//+------------------------------------------------------------------+
Comments