SilverTrend Signal w[1].Alert
Download script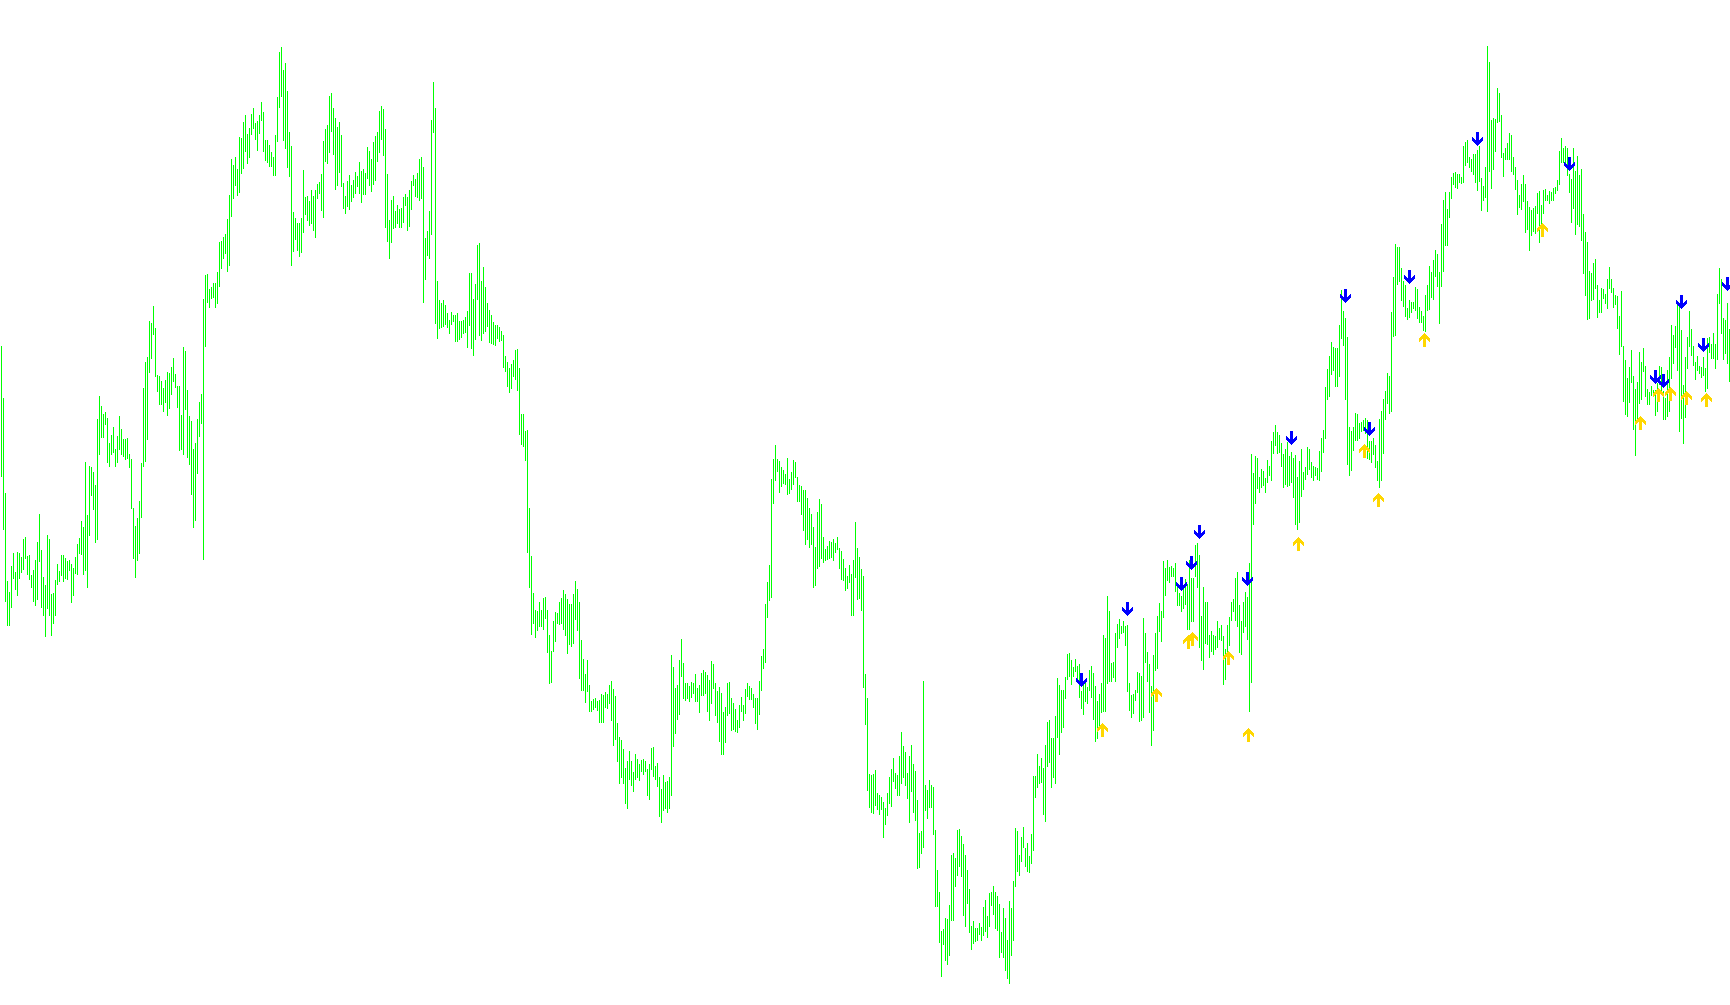
This script functions as a trend-following technical analysis tool designed to identify clear shifts in market momentum. It analyzes price action by looking at the relationship between current price movements and historical volatility over a specific look-back period.
Core Logic Overview
The primary objective of this tool is to determine whether the market is currently in an upward or downward "trend" state. It achieves this by establishing dynamic boundaries based on recent price highs and lows, rather than using fixed numerical values.
How the Analysis Works
- Volatility Measurement: The script first calculates the average price range (the distance between the highest high and lowest low) over a specific number of bars. This helps the tool understand how much the market "swings" normally.
- Dynamic Range Identification: It identifies the extreme highs and lows within its look-back window. From these extremes, it calculates a calculated "buffer zone."
- Trend Detection:
- The script tracks whether the closing price is breaking above or below these dynamically calculated boundaries.
- If the price closes significantly above the upper boundary, the logic registers an Uptrend.
- If the price closes significantly below the lower boundary, the logic registers a Downtrend.
- Signal Generation: A visual signal is only triggered at the exact moment the trend switches (e.g., when the market flips from a downtrend to an uptrend).
- Buy Signals: Marked on the chart when a transition into an uptrend is confirmed.
- Sell Signals: Marked on the chart when a transition into a downtrend is confirmed.
User Experience Features
- Visual Indicators: The script places specific arrows on the chart to highlight exactly where these trend shifts occur, making it easy to see entry points at a glance.
- Automated Alerts: To ensure traders don't have to watch the screen constantly, the tool can send real-time pop-up alerts the moment a "Buy" or "Sell" signal is detected on the current candle.
- Customizable Sensitivity: Users can adjust parameters like the "Risk" factor (which modifies how much of a breakout is required to trigger a signal) and the look-back period to make the tool more aggressive or conservative depending on their trading style.
Miscellaneous
16
Views
0
Downloads
0
Favorites
SilverTrend Signal w[1].Alert
//+------------------------------------------------------------------+
//| SilverTrend_Signal.mq4                                           |
//| Ramdass - Conversion only                                        |
//+------------------------------------------------------------------+
#property copyright "SilverTrend  rewritten by CrazyChart"
#property link      "http://viac.ru/"
//----
#property indicator_chart_window
#property indicator_buffers 2
#property indicator_color1 Aqua
#property indicator_color2 Violet
//---- input parameters
extern int RISK=3;
extern int CountBars=350;
extern int NumberofAlerts=2;
int SSP=9;
int counter=0;
//---- buffers
double val1[];
double val2[];
//+------------------------------------------------------------------+
//| Custom indicator initialization function                         |
//+------------------------------------------------------------------+
int init()
  {
   string short_name;
//---- indicator line
   IndicatorBuffers(2);
   SetIndexStyle(0,DRAW_ARROW);
   SetIndexArrow(0,233);
   SetIndexStyle(1,DRAW_ARROW);
   SetIndexArrow(1,234);
   SetIndexBuffer(0,val1);
   SetIndexBuffer(1,val2);
//----
   return(0);
  }
//+------------------------------------------------------------------+
//| SilverTrend_Signal                                               |
//+------------------------------------------------------------------+
int start()
  {
   if (CountBars>=Bars) CountBars=Bars;
   SetIndexDrawBegin(0,Bars-CountBars+SSP);
   SetIndexDrawBegin(1,Bars-CountBars+SSP);
   int i,shift,counted_bars=IndicatorCounted();
   int i1,i2,K;
   double Range,AvgRange,smin,smax,SsMax,SsMin,price;
   bool uptrend,old;
//----
   if(Bars<=SSP+1) return(0);
//---- initial zero
   if(counted_bars<SSP+1)
     {
      for(i=1;i<=SSP;i++) val1[CountBars-i]=0.0;
      for(i=1;i<=SSP;i++) val2[CountBars-i]=0.0;
     }
//----
   K=33-RISK;
   for(shift=CountBars-SSP; shift>=0; shift--)
     {
      Range=0;
      AvgRange=0;
      for(i1=shift; i1<=shift+SSP; i1++)
        {AvgRange=AvgRange+MathAbs(High[i1]-Low[i1]);
        }
      Range=AvgRange/(SSP+1);
//----
      SsMax=High[shift]; SsMin=Low[shift];
      for(i2=shift;i2<=shift+SSP-1;i2++)
        {
         price=High[i2];
         if(SsMax<price) SsMax=price;
         price=Low[i2];
         if(SsMin>=price)  SsMin=price;
        }
      smin=SsMin+(SsMax-SsMin)*K/100;
      smax=SsMax-(SsMax-SsMin)*K/100;
      val1[shift]=0;
      val2[shift]=0;
      if (Close[shift]<smin)
        {
         uptrend=false;
        }
      if (Close[shift]>smax)
        {
         uptrend=true;
        }
      if (uptrend!=old && uptrend==true)
        {
         val1[shift]=Low[shift]-Range*0.5;
         counter=0;
         if (shift==0 && counter<=NumberofAlerts)
           {
            Alert("Silver Trend ",Period()," ",Symbol()," BUY");
            counter=counter+1;
           }
        }
      if (uptrend!=old && uptrend==false)
        {
         counter=0;
         val2[shift]=High[shift]+Range*0.5;
         if (shift==0 && counter<=NumberofAlerts)
           {
            Alert("Silver Trend ",Period()," ",Symbol()," SELL");
            counter=counter+1;
           }
        }
      Comment(shift);
      old=uptrend;
     }
   return(0);
  }
//+------------------------------------------------------------------+
Comments