Big_Times
Download script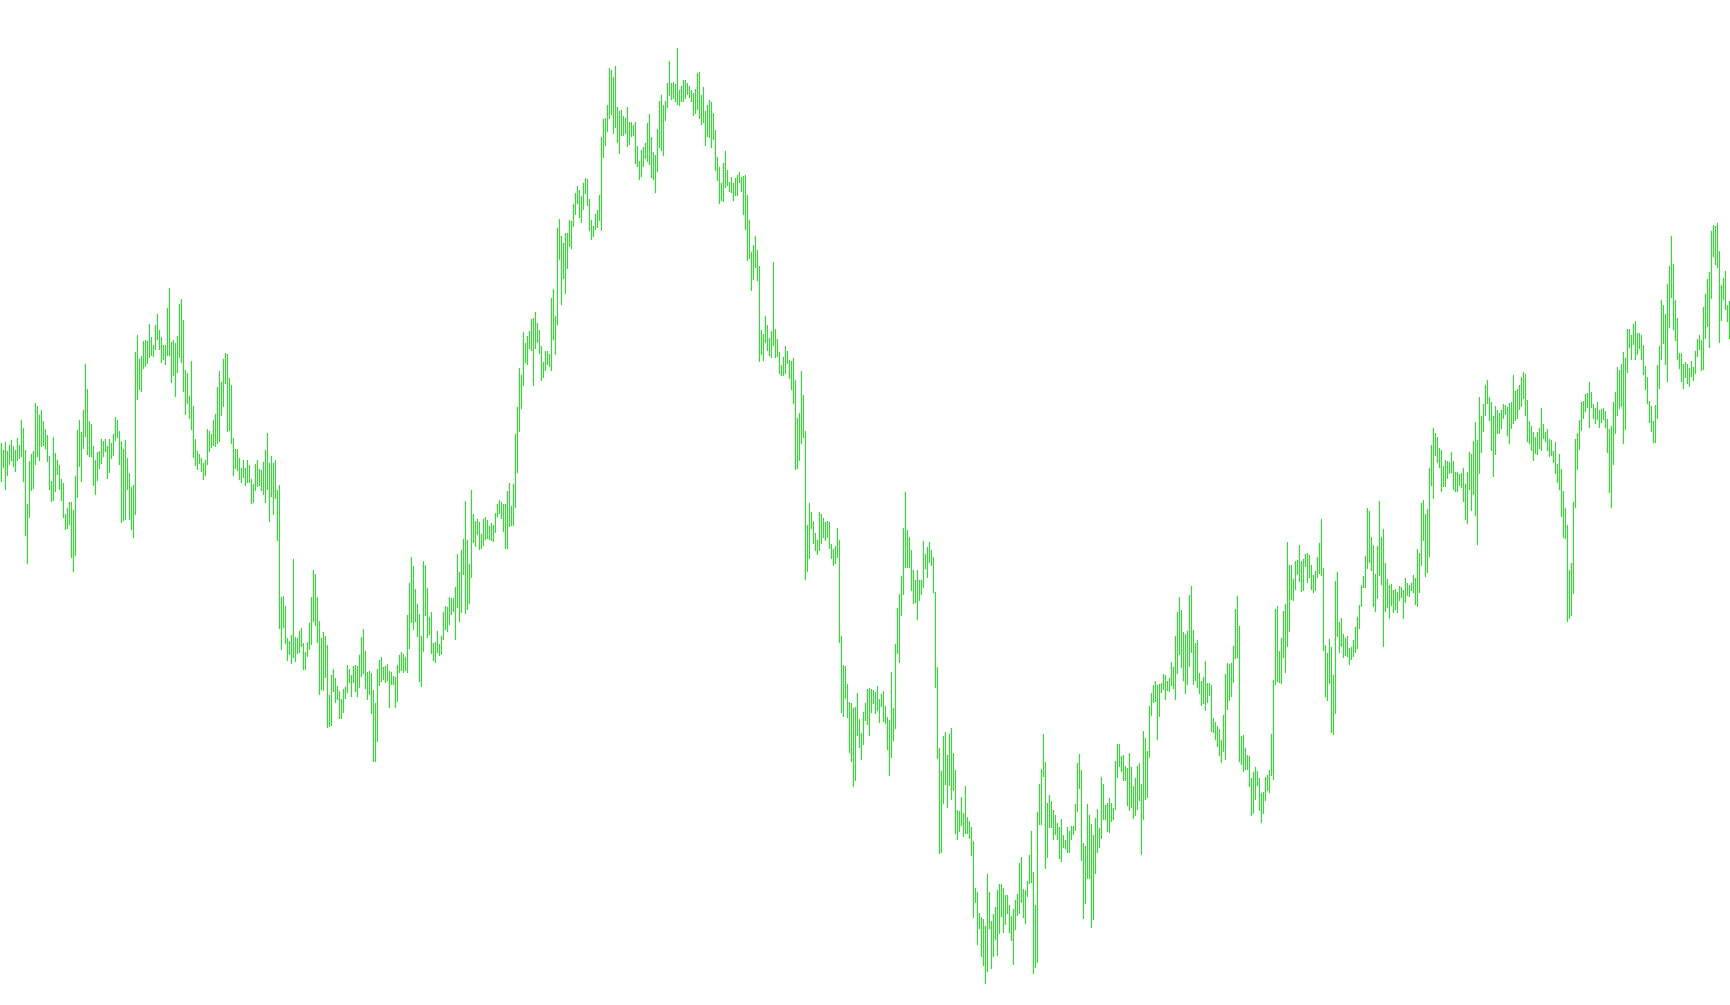
This tool is designed to provide traders with a visual representation of price volatility by measuring the intensity of price movement within specific timeframes. Instead of focusing on the direction of the market (whether it is going up or down), this indicator highlights the magnitude of the price swings.
How the Logic Works
The core functionality of this script is based on identifying the "spread" or the total distance traveled by the price during a single period (such as a minute, hour, or day). Here is the step-by-step breakdown of how it processes data:
- Measuring Price Range: For every candle or bar on your chart, the script identifies two specific points: the highest price reached (High) and the lowest price reached (Low).
- Calculating Difference: It subtracts the Low from the High to determine the total distance covered. By taking the absolute value of this calculation, the tool ensures that every movement is represented as a positive number, regardless of whether the market was trending upward or downward.
- Visual Representation: The resulting value is plotted as a histogram in a separate window. This creates a visual "spike" or bar; the taller the bar, the more significant the price movement was during that period.
Purpose and Practical Use
The primary goal of this logic is to help traders identify sudden price changes. In market analysis, extreme volatility often precedes a shift in trend or a change in market sentiment.
By monitoring these fluctuations, users can better recognize:
- High Volatility Zones: Periods where the market is reacting aggressively to news or technical levels.
- Trend Reversals: Sudden, outsized movements that may signal that the current market direction is losing steam and is about to turn.
- Market Exhaustion: Identifying when price swings become unusually large, which can sometimes indicate a climax in buying or selling pressure.
//+------------------------------------------------------------------+
//|                 This has been coded by MT-Coder                  |
//|                                                                  |
//|                     Email: mt-coder@hotmail.com                  |
//|                      Website: mt-coder.110mb.com                 |
//|                                                                  |
//|          I can code for you any strategy you have in mind        |
//|           into EA, I can code any indicator you have in mind     |
//|                                                                  |
//|                     For any programming idea                     |
//|          Don't hesitate to contact me at mt-coder@hotmail.com    |
//+------------------------------------------------------------------+

//+------------------------------------------------------------------+
//|        This indicator simply reflects the positive difference    |
//|              between the High and Low of the period.             |
//|         Sudden price changes may tell of change of direction     |
//|             for the trend. Enjoy!                                |
//+------------------------------------------------------------------+


#property copyright "Copyright © 2010, MT-Coder."
#property link      "http://mt-coder.110mb.com/"

#property indicator_separate_window
#property indicator_buffers 1
#property indicator_color1 Silver
//---- input parameters

//---- buffers
double MainBuffer[];

//+------------------------------------------------------------------+
//| Custom indicator initialization function                         |
//+------------------------------------------------------------------+
int init()
  {
   string short_name;
//----
   IndicatorBuffers(1);
   IndicatorDigits(Digits);
//---- indicator line
   SetIndexStyle(0,DRAW_HISTOGRAM);
   SetIndexBuffer(0,MainBuffer);

//---- name for DataWindow and indicator subwindow label
   short_name="Big Times - by mt-coder@hotmail.com";
   IndicatorShortName(short_name);
   SetIndexLabel(0,short_name);
//----
   return(0);
  }
//+------------------------------------------------------------------+
//| Bears Power                                                      |
//+------------------------------------------------------------------+
int start()
  {
   int i,counted_bars=IndicatorCounted();
//----

//----


//----
   int limit=Bars-counted_bars-1;
   for (i=limit; i>=0;i--)
     {
      MainBuffer[i]=MathAbs(Low[i]-High[i]);

     }
//----
   return(0);
  }
//+------------------------------------------------------------------+
Comments