VTS_VG_G3
Download script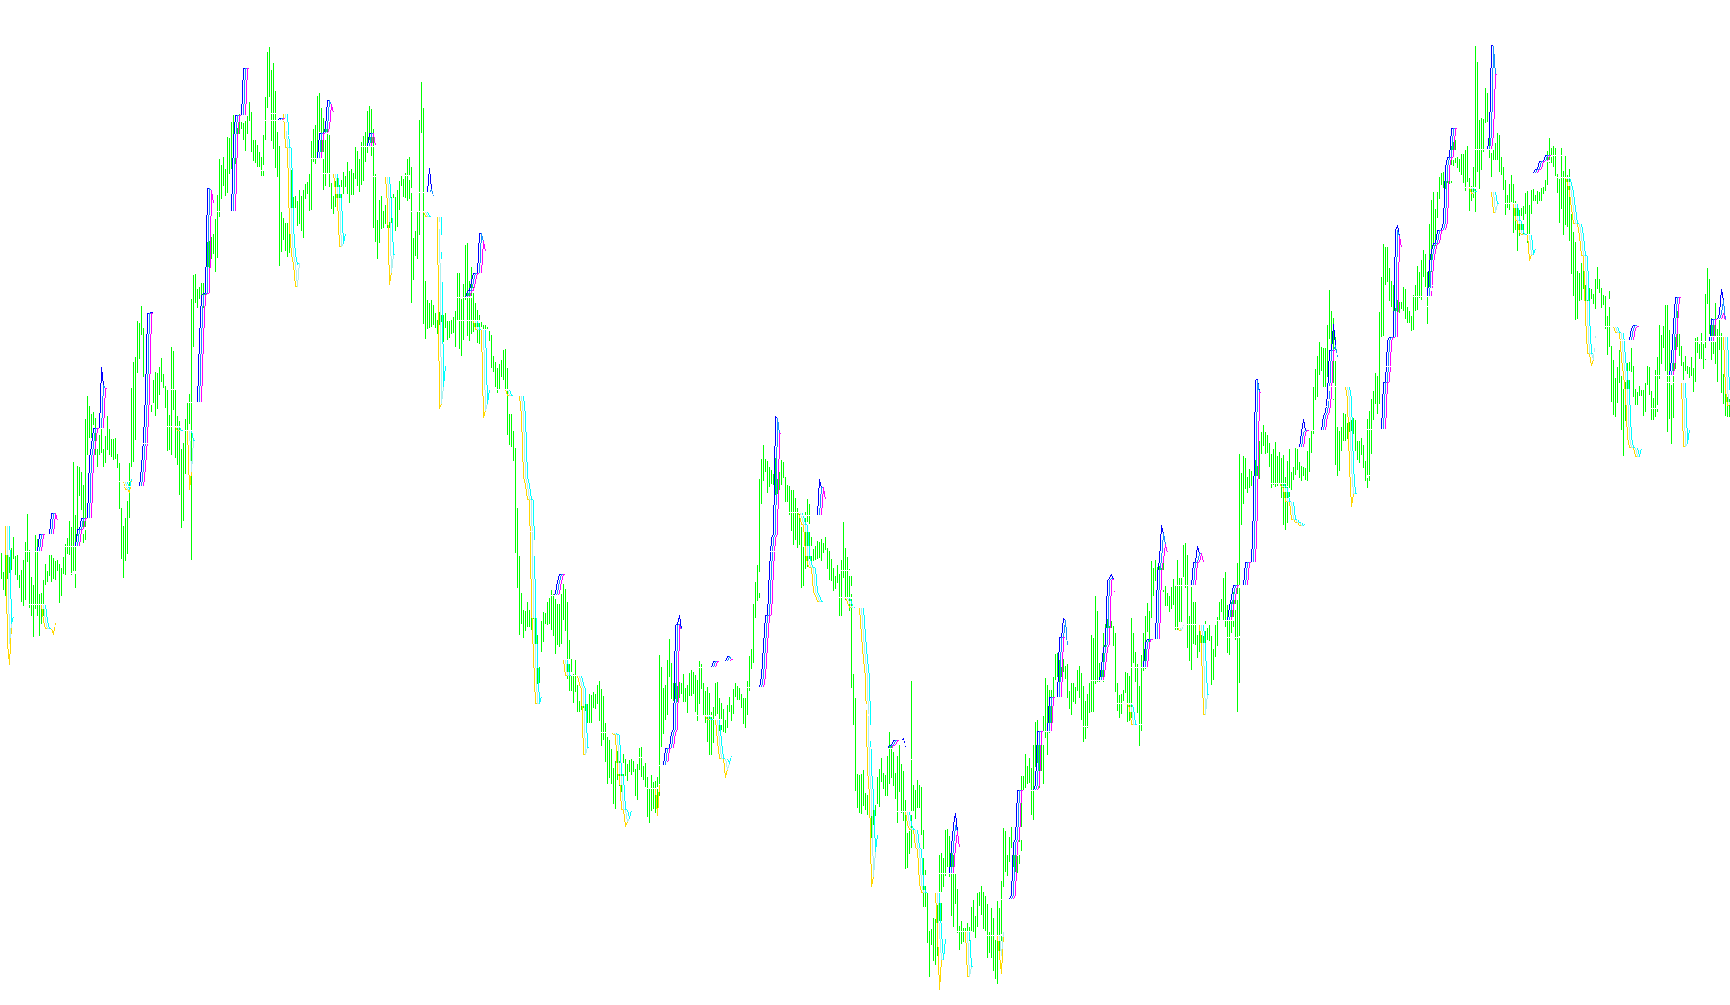
This custom indicator for MetaTrader 4 is designed to analyze price volatility and structural trends by creating a multi-layered "envelope" system. Instead of simply showing where the current price is, it calculates potential extremes based on historical market movement to identify significant support and resistance levels.
Core Logic and Functionality
1. Volatility-Based Boundaries The script begins by calculating a baseline volatility measure using the Average True Range (ATR). By multiplying this volatility by a user-defined multiplier, the indicator establishes a dynamic range around the current closing price. This creates two primary boundaries:
- An upper boundary based on the price plus the volatility offset.
- A lower boundary based on the price minus the volatility offset.
2. Recursive Multi-Layering (The "Nested" Effect) The unique characteristic of this script is how it processes these boundaries. Rather than just showing one set of lines, the indicator performs a series of sequential comparisons. It looks at the previous values of the calculated boundaries and compares them to the current ones to find the maximums and minimums.
This process repeats multiple times (creating various data sets labeled VTS2 through VTS23). By constantly comparing a value against its predecessor and selecting the highest or lowest point, the script effectively "filters" the price action.
3. Structural Identification The result of this repetitive logic is a series of increasingly refined layers. In practical terms, this creates a sophisticated visual structure on the chart that identifies:
- Trend Compression: Where price action stays tight within the innermost layers.
- Breakout Zones: Where price pushes through the outer, broader boundaries.
- Key Pivot Points: The "hard" levels established by the maximum and minimum peaks of the previous calculations.
Summary for the Trader
Think of this indicator as a way to see the "skeleton" of the market. By calculating how much the market usually moves (Volatility) and then mathematically layering those movements over each other, it strips away the noise of minor price fluctuations. This leaves the trader with a set of visual levels that represent significant structural milestones, helping to identify where the market might face resistance or find support based on historical volatility patterns.
//+------------------------------------------------------------------+
//|                                                          VTS.mq4 |
//|                                                             IZZY |
//|                                                                  |
//+------------------------------------------------------------------+
#property copyright "IZZY"
#property link      ""

#define MAXBARSCOUNT 15000

#property indicator_chart_window
#property indicator_buffers 8
#property indicator_color1 Aqua
#property indicator_color2 Magenta
#property indicator_color3 Aqua
#property indicator_color4 Magenta
#property indicator_color5 Aqua
#property indicator_color6 Magenta
#property indicator_color7 Aqua
#property indicator_color8 Magenta
//+------------------------------------------------------------------+
//| Custom indicator initialization function                         |
//+------------------------------------------------------------------+
//extern int Sb = 300;
extern int    PeriodAtr = 10;
extern double kATR      = 2.0;
extern int    GrupNum   = 3;

double VTS[MAXBARSCOUNT];
double VTS1[MAXBARSCOUNT];
double VTS2[MAXBARSCOUNT];
double VTS3[MAXBARSCOUNT];
double VTS4[MAXBARSCOUNT];
double VTS5[MAXBARSCOUNT];
double VTS6[MAXBARSCOUNT];
double VTS7[MAXBARSCOUNT];

double VTS8[MAXBARSCOUNT];
double VTS9[MAXBARSCOUNT];
double VTS10[MAXBARSCOUNT];
double VTS11[MAXBARSCOUNT];
double VTS12[MAXBARSCOUNT];
double VTS13[MAXBARSCOUNT];
double VTS14[MAXBARSCOUNT];
double VTS15[MAXBARSCOUNT];

double VTS16[MAXBARSCOUNT];
double VTS17[MAXBARSCOUNT];
double VTS18[MAXBARSCOUNT];
double VTS19[MAXBARSCOUNT];
double VTS20[MAXBARSCOUNT];
double VTS21[MAXBARSCOUNT];
double VTS22[MAXBARSCOUNT];
double VTS23[MAXBARSCOUNT];

int init()
  {
//---- indicators
   IndicatorBuffers(8);
   SetIndexBuffer(0, VTS16);
   SetIndexBuffer(1, VTS17);
   SetIndexBuffer(2, VTS18);
   SetIndexBuffer(3, VTS19);
   SetIndexBuffer(4, VTS20);
   SetIndexBuffer(5, VTS21);
   SetIndexBuffer(6, VTS22);
   SetIndexBuffer(7, VTS23);
//----
   return(0);
  }
//+------------------------------------------------------------------+
//| Custor indicator deinitialization function                       |
//+------------------------------------------------------------------+
int deinit()
  {
//----

//----
   return(0);
  }
//+------------------------------------------------------------------+
//| Custom indicator iteration function                              |
//+------------------------------------------------------------------+

int start()
  {
   int    counted_bars=IndicatorCounted();
//----

int    StartBars = Bars - counted_bars+2;
   //if (StartBars<Sb) StartBars = Sb;
   for(int i = StartBars; i>=0; i--){
       VTS[i] = (Close[i]-kATR*iATR(NULL,0,PeriodAtr,i));
       VTS1[i]= (Close[i]+kATR*iATR(NULL,0,PeriodAtr,i));
       }
   for(i = StartBars-1; i>0; i--){
       VTS2[i]= MathMax(VTS[i],VTS[i+1]);
       VTS3[i]= MathMin(VTS1[i],VTS1[i+1]);
       VTS4[i]= MathMax(VTS2[i],VTS2[i+1]);//VTS2[i+1];
       VTS5[i]= MathMin(VTS3[i],VTS3[i+1]);//VTS3[i+1];
       VTS6[i]= MathMax(VTS4[i],VTS4[i+1]);//VTS4[i+1];
       VTS7[i]= MathMin(VTS5[i],VTS5[i+1]);//VTS5[i+1];
       VTS8[i]= MathMax(VTS6[i],VTS6[i+1]);//VTS6[i+1];
       VTS9[i]= MathMin(VTS7[i],VTS7[i+1]);//VTS7[i+1];
       VTS10[i]= MathMax(VTS8[i],VTS8[i+1]);//VTS8[i+1];
       VTS11[i]= MathMin(VTS9[i],VTS9[i+1]);//VTS9[i+1];
       VTS12[i]= MathMax(VTS10[i],VTS10[i+1]);//VTS10[i+1];
       VTS13[i]= MathMin(VTS11[i],VTS11[i+1]);//VTS11[i+1];
       VTS14[i]= MathMax(VTS12[i],VTS12[i+1]);//VTS10[i+1];
       VTS15[i]= MathMin(VTS13[i],VTS13[i+1]);//VTS11[i+1];
       VTS16[i]= MathMax(VTS14[i],VTS14[i+1]);//VTS6[i+1];
       VTS17[i]= MathMin(VTS15[i],VTS15[i+1]);//VTS7[i+1];
       VTS18[i]= MathMax(VTS16[i],VTS16[i+1]);//VTS6[i+1];
       VTS19[i]= MathMin(VTS17[i],VTS17[i+1]);//VTS7[i+1];
       VTS20[i]= MathMax(VTS18[i],VTS18[i+1]);//VTS6[i+1];
       VTS21[i]= MathMin(VTS19[i],VTS19[i+1]);//VTS7[i+1];
       VTS22[i]= MathMax(VTS20[i],VTS20[i+1]);//VTS6[i+1];
       VTS23[i]= MathMin(VTS21[i],VTS21[i+1]);//VTS7[i+1];
       }

//----
   return(0);
  }
//+------------------------------------------------------------------+
Comments