VTS_G3
Download script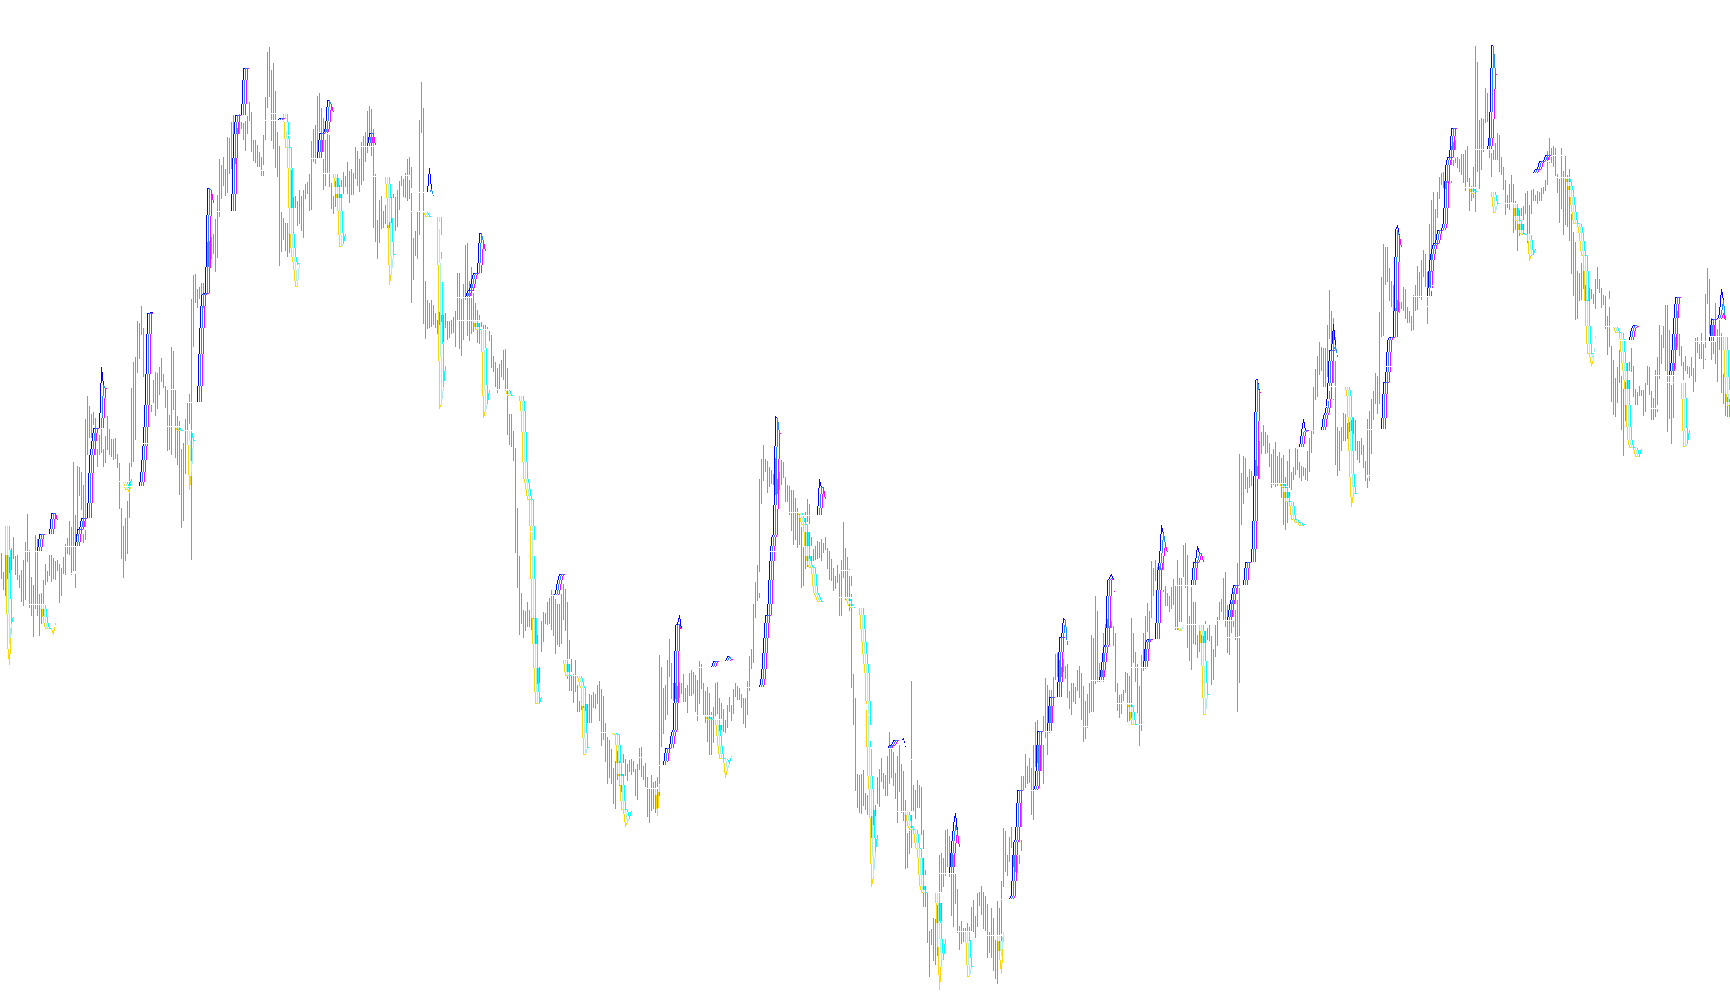
The VTS indicator is a specialized technical analysis tool designed to identify significant price boundaries and structural shifts in the market. Unlike standard indicators that follow price directly, this script focuses on calculating "volatility envelopes" and progressively refining them to highlight major support and resistance levels.
Core Logic Overview
The logic of the script can be broken down into three distinct phases:
1. Volatility Baseline Calculation The tool begins by establishing a baseline of market volatility using the Average True Range (ATR). It takes the current closing price and projects two boundaries:
- An Upper Boundary: Calculated by adding a multiple of the volatility to the price.
- A Lower Boundary: Calculated by subtracting that same volatility multiple from the price. This creates a "channel" that represents the expected range of movement based on recent market conditions.
2. Recursive Extremum Tracking Once the initial upper and lower boundaries are established, the script enters a sophisticated recursive calculation phase. It compares the current values of these boundaries against the previous candles to identify peaks (highs) and troughs (lows).
Instead of just looking at the most recent price point, it performs multiple layers of "Max" and "Min" comparisons. Each successive layer acts as a filter, smoothing out minor market noise and "micro-fluctuations."
3. Multi-Layered Filtering (The "VTS" Layers) The script repeats this comparison process across 23 different internal variables. By nesting these comparisons, the logic creates a hierarchy of data:
- Early Layers: Capture immediate price reactions and short-term volatility.
- Deeper Layers: Gradually filter out "fakeouts" and minor pullbacks, eventually identifying the broader structural boundaries of the market trend.
Visual Representation & Purpose
The final results are displayed as eight distinct visual lines on your chart. These lines represent the most refined high-water marks and low-water marks derived from the recursive filtering process.
In practical terms, for a trader:
- The Upper Lines act as dynamic resistance zones where the price has historically struggled to break through after accounting for volatility.
- The Lower Lines act as dynamic support zones where the price has shown significant "flooring" behavior.
By filtering the price through these multiple layers of logic, the VTS indicator aims to provide a clearer picture of the market's true structural limits, helping users distinguish between temporary price spikes and significant trend reversals.
//+------------------------------------------------------------------+
//|                                                          VTS.mq4 |
//|                                                             IZZY |
//|                                                                  |
//+------------------------------------------------------------------+
#property copyright "IZZY"
#property link      ""

#define MAXBARSCOUNT 15000

#property indicator_chart_window
#property indicator_buffers 8
#property indicator_color1 Aqua
#property indicator_color2 Magenta
#property indicator_color3 Aqua
#property indicator_color4 Magenta
#property indicator_color5 Aqua
#property indicator_color6 Magenta
#property indicator_color7 Aqua
#property indicator_color8 Magenta
//+------------------------------------------------------------------+
//| Custom indicator initialization function                         |
//+------------------------------------------------------------------+
//extern int Sb = 300;
extern int    PeriodAtr = 10;
extern double kATR      = 2.0;
extern int    GrupNum   = 3;

double VTS[MAXBARSCOUNT];
double VTS1[MAXBARSCOUNT];
double VTS2[MAXBARSCOUNT];
double VTS3[MAXBARSCOUNT];
double VTS4[MAXBARSCOUNT];
double VTS5[MAXBARSCOUNT];
double VTS6[MAXBARSCOUNT];
double VTS7[MAXBARSCOUNT];

double VTS8[MAXBARSCOUNT];
double VTS9[MAXBARSCOUNT];
double VTS10[MAXBARSCOUNT];
double VTS11[MAXBARSCOUNT];
double VTS12[MAXBARSCOUNT];
double VTS13[MAXBARSCOUNT];
double VTS14[MAXBARSCOUNT];
double VTS15[MAXBARSCOUNT];

double VTS16[MAXBARSCOUNT];
double VTS17[MAXBARSCOUNT];
double VTS18[MAXBARSCOUNT];
double VTS19[MAXBARSCOUNT];
double VTS20[MAXBARSCOUNT];
double VTS21[MAXBARSCOUNT];
double VTS22[MAXBARSCOUNT];
double VTS23[MAXBARSCOUNT];

int init()
  {
//---- indicators
   IndicatorBuffers(8);
   SetIndexBuffer(0, VTS16);
   SetIndexBuffer(1, VTS17);
   SetIndexBuffer(2, VTS18);
   SetIndexBuffer(3, VTS19);
   SetIndexBuffer(4, VTS20);
   SetIndexBuffer(5, VTS21);
   SetIndexBuffer(6, VTS22);
   SetIndexBuffer(7, VTS23);
//----
   return(0);
  }
//+------------------------------------------------------------------+
//| Custor indicator deinitialization function                       |
//+------------------------------------------------------------------+
int deinit()
  {
//----

//----
   return(0);
  }
//+------------------------------------------------------------------+
//| Custom indicator iteration function                              |
//+------------------------------------------------------------------+

int start()
  {
   int    counted_bars=IndicatorCounted();
//----

int    StartBars = Bars - counted_bars+1;
   //if (StartBars<Sb) StartBars = Sb;
   for(int i = StartBars; i>=0; i--){
       VTS[i] = (Close[i]-kATR*iATR(NULL,0,PeriodAtr,i));
       VTS1[i]= (Close[i]+kATR*iATR(NULL,0,PeriodAtr,i));
       }
   for(i = StartBars-1; i>0; i--){
       VTS2[i]= MathMax(VTS[i],VTS[i+1]);
       VTS3[i]= MathMin(VTS1[i],VTS1[i+1]);
       VTS4[i]= MathMax(VTS2[i],VTS2[i+1]);//VTS2[i+1];
       VTS5[i]= MathMin(VTS3[i],VTS3[i+1]);//VTS3[i+1];
       VTS6[i]= MathMax(VTS4[i],VTS4[i+1]);//VTS4[i+1];
       VTS7[i]= MathMin(VTS5[i],VTS5[i+1]);//VTS5[i+1];
       VTS8[i]= MathMax(VTS6[i],VTS6[i+1]);//VTS6[i+1];
       VTS9[i]= MathMin(VTS7[i],VTS7[i+1]);//VTS7[i+1];
       VTS10[i]= MathMax(VTS8[i],VTS8[i+1]);//VTS8[i+1];
       VTS11[i]= MathMin(VTS9[i],VTS9[i+1]);//VTS9[i+1];
       VTS12[i]= MathMax(VTS10[i],VTS10[i+1]);//VTS10[i+1];
       VTS13[i]= MathMin(VTS11[i],VTS11[i+1]);//VTS11[i+1];
       VTS14[i]= MathMax(VTS12[i],VTS12[i+1]);//VTS10[i+1];
       VTS15[i]= MathMin(VTS13[i],VTS13[i+1]);//VTS11[i+1];
       VTS16[i]= MathMax(VTS14[i],VTS14[i+1]);//VTS6[i+1];
       VTS17[i]= MathMin(VTS15[i],VTS15[i+1]);//VTS7[i+1];
       VTS18[i]= MathMax(VTS16[i],VTS16[i+1]);//VTS6[i+1];
       VTS19[i]= MathMin(VTS17[i],VTS17[i+1]);//VTS7[i+1];
       VTS20[i]= MathMax(VTS18[i],VTS18[i+1]);//VTS6[i+1];
       VTS21[i]= MathMin(VTS19[i],VTS19[i+1]);//VTS7[i+1];
       VTS22[i]= MathMax(VTS20[i],VTS20[i+1]);//VTS6[i+1];
       VTS23[i]= MathMin(VTS21[i],VTS21[i+1]);//VTS7[i+1];
       }

//----
   return(0);
  }
//+------------------------------------------------------------------+
Comments