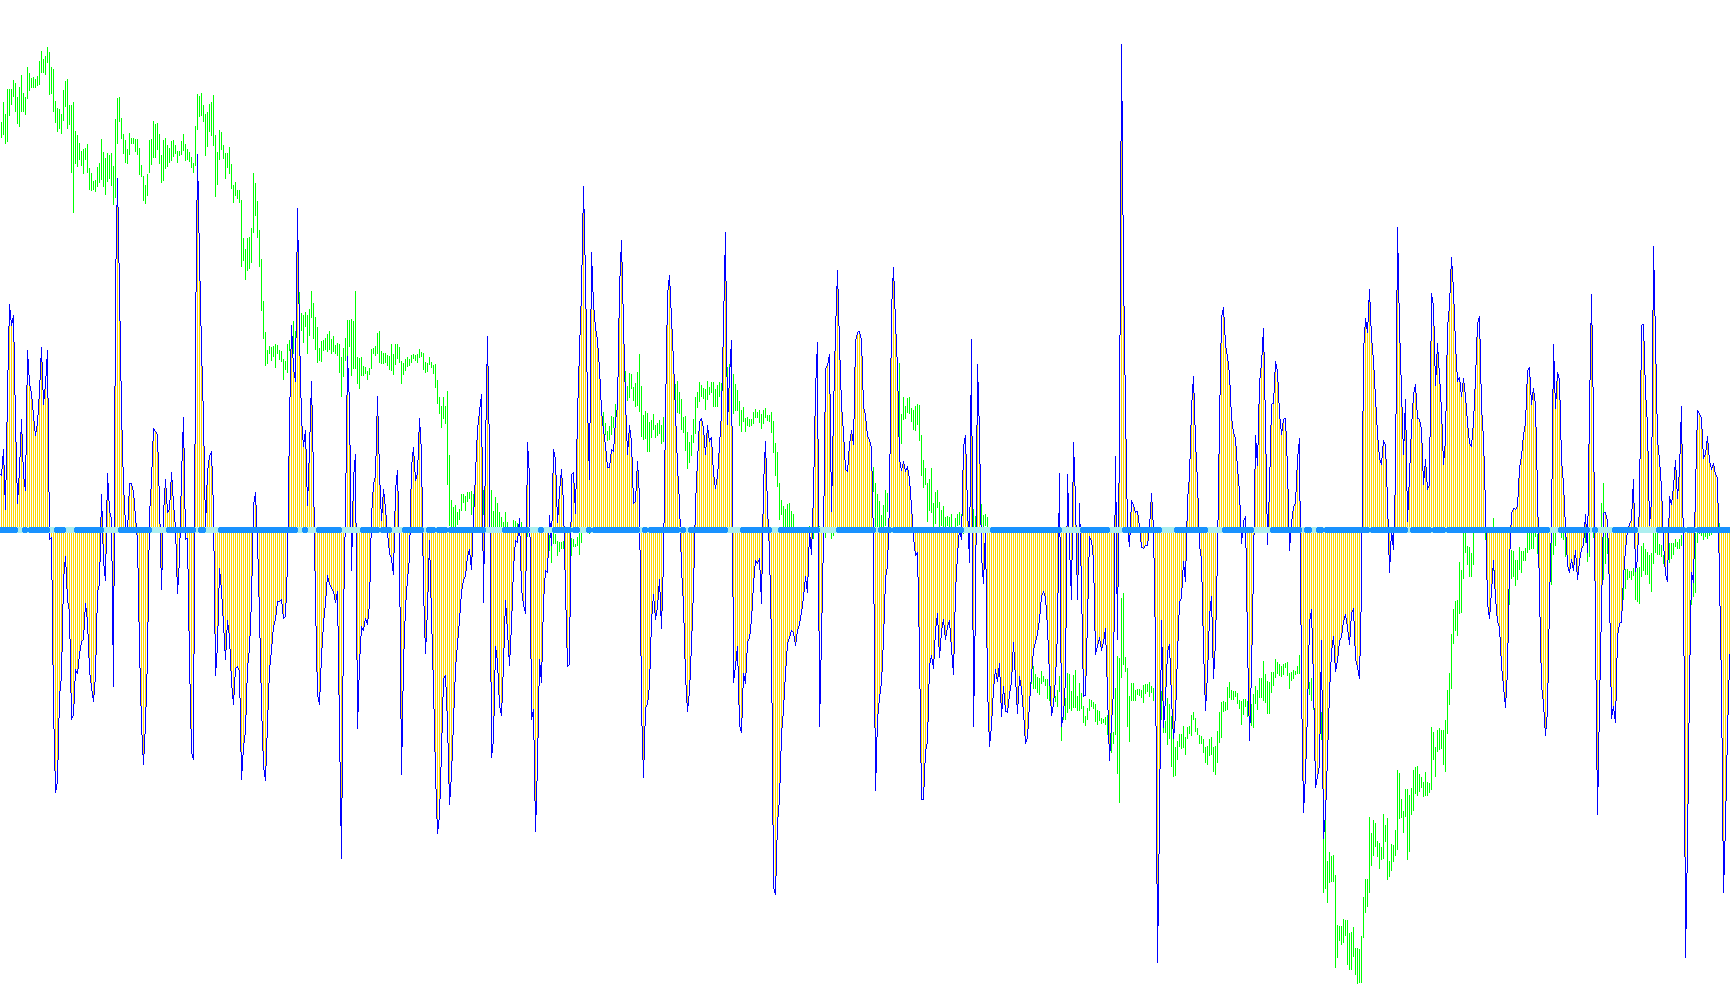
This script is a custom technical analysis tool designed for the MetaTrader platform. It combines several complex mathematical concepts into a single visual indicator to help traders identify specific market conditions—specifically, when the market is "squeezing" or preparing for a significant move.
Core Logic Overview
The tool functions by calculating and comparing three different types of market data: moving averages, price deviations, and volatility measurements. By layering these together, it identifies periods where price action is unusually tight relative to its historical average.
Key Components of the Analysis
1. The CCI Component (Commodity Channel Index) The script first calculates a variation of the Commodity Channel Index. It does this by:
- Establishing a "baseline" using a moving average of recent prices.
- Measuring the distance between the current price and that baseline.
- Calculating the standard deviation to determine how much the price typically fluctuates.
- By dividing the price distance by the deviation, it provides a normalized view of whether the current price is overextended or compressed.
2. The "Squeeze" Calculation The most unique part of this script is how it identifies a market "squeeze." It compares two different volatility measurements:
- ATR (Average True Range): This measures the general range of the candles.
- Standard Deviation: This measures the dispersion of prices from their average.
The logic looks for a specific ratio between these two figures. When the standard deviation becomes very small compared to the ATR (specifically when the resulting calculation falls below a certain threshold), it indicates that the market is becoming abnormally quiet.
Visual Signals and Alerts
The tool translates these complex calculations into three visual elements on your chart:
- Histograms and Lines: These represent the smoothed CCI data, showing the general momentum and position of the price relative to its recent history.
- Directional Arrows: The script monitors the "squeeze" state in real-time. When the mathematical conditions for a squeeze are met, it triggers visual markers on the chart to alert you to the potential buildup of energy.
- Active Notifications: Depending on your settings, the script can provide instant feedback through pop-up alerts or audio files the moment these specific market conditions occur.
Summary for the Trader
In plain terms, this script acts as an "early warning system." It filters out the noise of daily price movements to highlight moments where the market is consolidating. When the "squeeze" occurs, it suggests that volatility is being suppressed and may soon break out in one direction or the other, providing a visual cue for potential trading opportunities.
//+------------------------------------------------------------------+
//|                                                   CCISqueeze.mq4 |
//|                                                                  |
//|                                           Original BBSqueeze.mq4 |
//|                Copyright © 2005, Nick Bilak, beluck[AT]gmail.com |
//|                                    http://metatrader.50webs.com/ |
//+------------------------------------------------------------------+
#property copyright "Copyright © 2006, ch33z3"
#property link      "http://4xjournal.blogspot.com/"

#property indicator_separate_window
#property indicator_buffers 4
#property indicator_color1 DeepSkyBlue
#property indicator_color2 Blue
#property indicator_color3 Red
#property indicator_color4 Green
//---- input parameters
extern int CCIPeriod=14;
extern int ApplyTo=5;
extern int BBPeriod=20;
extern double BBDeviation=2.0;
extern int KCPeriod=02;
extern double KCFactor=1.5;
extern bool AlertBox=false;
extern bool AudioAlert=false;
//---- buffers
double CCIBuffer[];
double CCIBuffer2[];
double RelBuffer[];
double DevBuffer[];
double MovBuffer[];
double upK[];
double loK[];
//+------------------------------------------------------------------+
//| Custom indicator initialization function                         |
//+------------------------------------------------------------------+
int init()
  {
   string short_name;
//---- 3 additional buffers are used for counting.
   IndicatorBuffers(7);
   SetIndexBuffer(4, RelBuffer);
   SetIndexBuffer(5, DevBuffer);
   SetIndexBuffer(6, MovBuffer);
//---- indicator lines
   SetIndexStyle(0,DRAW_HISTOGRAM);
   SetIndexBuffer(0,CCIBuffer);
   SetIndexStyle(1,DRAW_LINE);
   SetIndexBuffer(1,CCIBuffer2);
//---- name for DataWindow and indicator subwindow label
   short_name="CCI("+CCIPeriod+")";
   IndicatorShortName(short_name);
   SetIndexLabel(0,short_name);
//----
   SetIndexDrawBegin(0,CCIPeriod);
   SetIndexDrawBegin(1,CCIPeriod);
//----
   SetIndexStyle(2,DRAW_ARROW,0,2);
   SetIndexBuffer(2,upK);
   SetIndexEmptyValue(2,EMPTY_VALUE);
   SetIndexArrow(2,159);

   SetIndexStyle(3,DRAW_ARROW,0,2);
   SetIndexBuffer(3,loK);
   SetIndexEmptyValue(3,EMPTY_VALUE);
   SetIndexArrow(3,159);

   return(0);
  }
//+------------------------------------------------------------------+
//| Commodity Channel Index                                          |
//+------------------------------------------------------------------+
int start()
  {
   int    i,k,counted_bars=IndicatorCounted();
   double price,sum,mul;
   if(Bars<=CCIPeriod) return(0);
//---- initial zero
   if(counted_bars<1)
     {
      for(i=1;i<=CCIPeriod;i++) CCIBuffer[Bars-i]=0.0;
      for(i=1;i<=CCIPeriod;i++) CCIBuffer2[Bars-i]=0.0;
      for(i=1;i<=CCIPeriod;i++) DevBuffer[Bars-i]=0.0;
      for(i=1;i<=CCIPeriod;i++) MovBuffer[Bars-i]=0.0;
     }
//---- last counted bar will be recounted
   int limit=Bars-counted_bars;
   if(counted_bars>0) limit++;
//---- moving average
   for(i=0; i<limit; i++)
      MovBuffer[i]=iMA(NULL,0,CCIPeriod,0,MODE_SMA,ApplyTo,i);
//---- standard deviations
   i=Bars-CCIPeriod+1;
   if(counted_bars>CCIPeriod-1) i=Bars-counted_bars-1;
   mul=0.015/CCIPeriod;
   while(i>=0)
     {
      sum=0.0;
      k=i+CCIPeriod-1;
      while(k>=i)
       {
         price=(High[k]+Low[k]+Close[k])/3;
         sum+=MathAbs(price-MovBuffer[i]);
         k--;
       }
      DevBuffer[i]=sum*mul;
      i--;
     }
   i=Bars-CCIPeriod+1;
   if(counted_bars>CCIPeriod-1) i=Bars-counted_bars-1;
   while(i>=0)
     {
      price=(High[i]+Low[i]+Close[i])/3;
      RelBuffer[i]=price-MovBuffer[i];
      i--;
     }
//---- cci counting
   i=Bars-CCIPeriod+1;
   if(counted_bars>CCIPeriod-1) i=Bars-counted_bars-1;
   while(i>=0)
     {
      if(DevBuffer[i]==0.0) {
      CCIBuffer[i]=0.0;
      CCIBuffer2[i]=0.0; }
      else {
      CCIBuffer[i]=RelBuffer[i]/DevBuffer[i];
      CCIBuffer2[i]=RelBuffer[i]/DevBuffer[i]; }
      i--;
     }
//---- squeeze
   double diff, std, bbs;
   for(i=0; i<=limit; i++) {
   diff = iATR(NULL,0,KCPeriod,i)*KCFactor;
   std = iStdDev(NULL,0,BBPeriod,MODE_SMA,0,PRICE_CLOSE,i);
	bbs = BBDeviation * std / diff;

   if(bbs<1) {
      upK[i]=0;
      loK[i]=EMPTY_VALUE; }

   else {
      loK[i]=0;
      upK[i]=EMPTY_VALUE;

      if (AlertBox == true && i == 0) Alert("Alert for ", Symbol(), " on ", Period(), " chart!");
      if (AudioAlert == true && i == 0) PlaySound("alert.wav"); } }
   return(0);
  }
//+------------------------------------------------------------------+
Comments