CCI_v1
Download script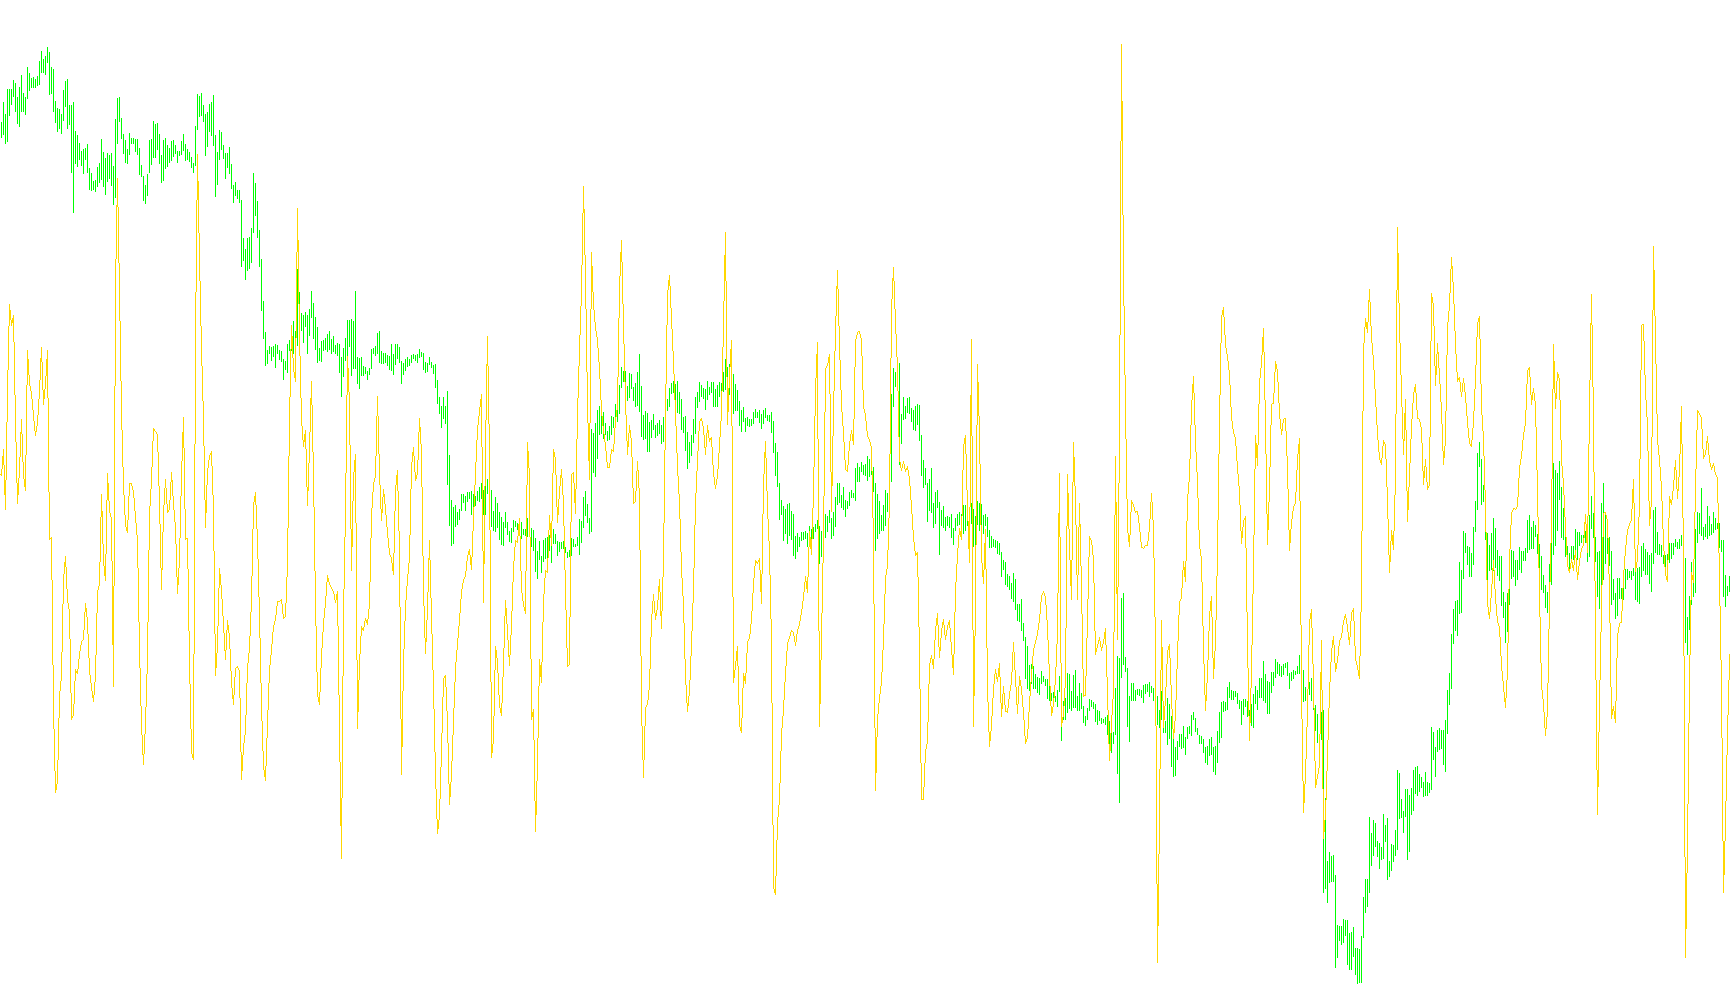
This script is a technical analysis tool designed to help traders identify whether the price of a financial asset is currently overbought, oversold, or moving in a specific direction relative to its historical average. It calculates what is known as the Commodity Channel Index (CCI), which serves as a momentum oscillator.
How the Logic Works
The script processes market data through a series of mathematical steps to transform raw price action into a readable trend line:
1. Establishing the Baseline (Moving Average) First, the tool looks at a specific number of past candles (defined by the "Period" setting) to determine the "Typical Price." It calculates the average of the High, Low, and Close prices for each candle. By averaging these over time, the script creates a baseline that represents the "normal" price behavior.
2. Measuring Volatility (Standard Deviation) The script then analyzes how much the current price fluctuates away from that baseline. It calculates the average distance between the actual prices and the moving average. This step is crucial because it tells the tool how "volatile" the market is—it distinguishes between steady, calm movement and sharp, erratic swings.
3. Determining Relative Position Next, the script calculates the raw difference between the current price and the moving average. This tells us if the price is currently higher or lower than its recent historical trend.
4. Final Calculation (The CCI Value) To produce the final indicator line, the script divides the "Relative Position" by the "Volatility."
- By dividing these two numbers, the tool normalizes the data. This ensures that the resulting index accounts for how much the price usually moves; a large move in a high-volatility market might be treated the same as a small move in a low-volatility market.
Practical Outcome
The final result is displayed as a line in a separate window on your chart. Because the logic measures the distance from the average relative to volatility, it allows traders to see:
- Momentum: How fast the price is moving in one direction.
- Extreme Levels: When the line moves significantly far from the zero mark, it suggests that the price may be stretched too far in one direction and could be due for a correction or reversal.
//+------------------------------------------------------------------+
//|                                                          CCI.mq4 |
//|                      Copyright © 2004, MetaQuotes Software Corp. |
//|                                       http://www.metaquotes.net/ |
//+------------------------------------------------------------------+
#property copyright "Copyright © 2004, MetaQuotes Software Corp."
#property link      "http://www.metaquotes.net/"

#property indicator_separate_window
#property indicator_buffers 1
#property indicator_color1 LightSeaGreen
//---- input parameters
extern int CCIPeriod=14;
//---- buffers
double CCIBuffer[];
double RelBuffer[];
double DevBuffer[];
double MovBuffer[];
//+------------------------------------------------------------------+
//| Custom indicator initialization function                         |
//+------------------------------------------------------------------+
int init()
  {
   string short_name;
//---- 3 additional buffers are used for counting.
   IndicatorBuffers(4);
   SetIndexBuffer(1, RelBuffer);
   SetIndexBuffer(2, DevBuffer);
   SetIndexBuffer(3, MovBuffer);
//---- indicator lines
   SetIndexStyle(0,DRAW_LINE);
   SetIndexBuffer(0,CCIBuffer);
//---- name for DataWindow and indicator subwindow label
   short_name="CCI("+CCIPeriod+")";
   IndicatorShortName(short_name);
   SetIndexLabel(0,short_name);
//----
   SetIndexDrawBegin(0,CCIPeriod);
//----
   return(0);
  }
//+------------------------------------------------------------------+
//| Commodity Channel Index                                          |
//+------------------------------------------------------------------+
int start()
  {
   int    i,k,counted_bars=IndicatorCounted();
   double price,sum,mul;
   if(Bars<=CCIPeriod) return(0);
//---- initial zero
   if(counted_bars<1)
     {
      for(i=1;i<=CCIPeriod;i++) CCIBuffer[Bars-i]=0.0;
      for(i=1;i<=CCIPeriod;i++) DevBuffer[Bars-i]=0.0;
      for(i=1;i<=CCIPeriod;i++) MovBuffer[Bars-i]=0.0;
     }
//---- last counted bar will be recounted
   int limit=Bars-counted_bars;
   if(counted_bars>0) limit++;
//---- moving average
   for(i=0; i<limit; i++)
      MovBuffer[i]=iMA(NULL,0,CCIPeriod,0,MODE_SMA,PRICE_TYPICAL,i);
//---- standard deviations
   i=Bars-CCIPeriod+1;
   if(counted_bars>CCIPeriod-1) i=Bars-counted_bars-1;
   mul=0.015/CCIPeriod;
   while(i>=0)
     {
      sum=0.0;
      k=i+CCIPeriod-1;
      while(k>=i)
       {
         price=(High[k]+Low[k]+Close[k])/3;
         sum+=MathAbs(price-MovBuffer[i]);
         k--;
       }
      DevBuffer[i]=sum*mul;
      i--;
     }
   i=Bars-CCIPeriod+1;
   if(counted_bars>CCIPeriod-1) i=Bars-counted_bars-1;
   while(i>=0)
     {
      price=(High[i]+Low[i]+Close[i])/3;
      RelBuffer[i]=price-MovBuffer[i];
      i--;
     }
//---- cci counting
   i=Bars-CCIPeriod+1;
   if(counted_bars>CCIPeriod-1) i=Bars-counted_bars-1;
   while(i>=0)
     {
      if(DevBuffer[i]==0.0) CCIBuffer[i]=0.0;
      else CCIBuffer[i]=RelBuffer[i]/DevBuffer[i];
      i--;
     }
//----
   return(0);
  }
//+------------------------------------------------------------------+
Comments