JMA_CCI [i]
Download script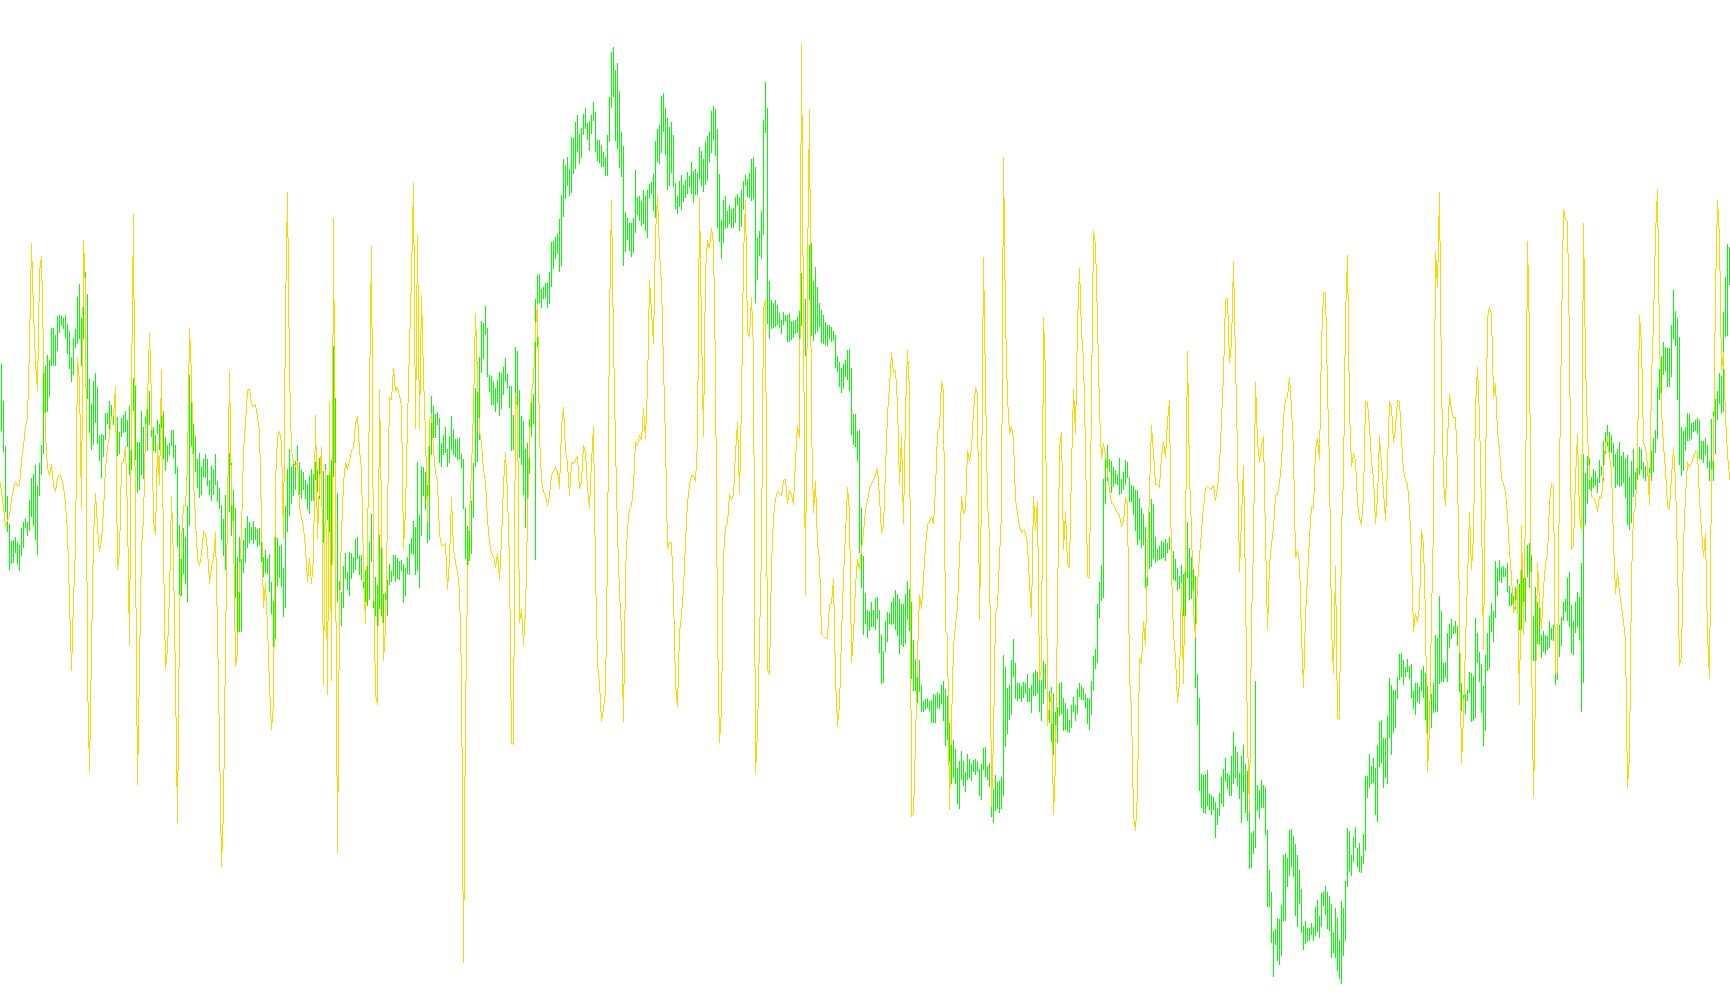
This tool is designed to provide traders with a specialized visual representation of market momentum and price deviations. It functions by blending two distinct types of financial analysis: a smoothed trend indicator (JMA) and a relative strength measurement (CCI).
How the Logic Works
The script processes market data through three primary layers to arrive at its final visual output:
1. Smoothing the Trend Instead of looking at raw, erratic price movements, the tool first calculates a "Moving Average" using a specific smoothing method. This identifies the underlying trend of the market while filtering out the minor "noise" that can often distract from the larger picture.
2. Measuring Price Deviation and Relation Once the primary trend is established, the logic performs two simultaneous calculations for every candle on the chart:
- The Gap (Relation): It calculates the distance between the current price and the smoothed trend line. This tells the tool how far the price has moved away from its "average" path.
- The Volatility (Deviation): It measures the standard variation of the price within a specific window of time. By looking at the highs, lows, and closing prices, it determines how much the market is "swinging."
3. The Final Calculation The final value displayed on your screen is produced by dividing the Price Gap by the Volatility.
Practical Meaning for the User
By dividing the distance from the trend by the current volatility, the indicator provides a normalized look at market momentum.
- When the resulting value is high, it suggests that the price is moving significantly away from its average relative to how much it usually fluctuates.
- When the value is low (or near zero), it indicates the price is hugging the trend line closely or that market volatility is very low.
In short, this script helps you see not just where the price is going, but how "stretched" or "compressed" the current movement is compared to historical behavior in that specific timeframe.
//+------------------------------------------------------------------+
//|                                                          JMA_CCI.mq4 |
//|                      Copyright © 2004, MetaQuotes Software Corp. |
//|                                       http://www.metaquotes.net/ |
//+------------------------------------------------------------------+
#property copyright "Copyright © 2004, scorpion."
#property link      "http://www.fxfisherman.com/"

#property indicator_separate_window
#property indicator_buffers 1
#property indicator_color1 LightSeaGreen
//---- input parameters
extern int CCIPeriod=14;
extern int JMAPhrase=0;
//---- buffers
double CCIBuffer[];
double RelBuffer[];
double DevBuffer[];
double MovBuffer[];
//+------------------------------------------------------------------+
//| Custom indicator initialization function                         |
//+------------------------------------------------------------------+
int init()
  {
   string short_name;
//---- 3 additional buffers are used for counting.
   IndicatorBuffers(4);
   SetIndexBuffer(1, RelBuffer);
   SetIndexBuffer(2, DevBuffer);
   SetIndexBuffer(3, MovBuffer);
//---- indicator lines
   SetIndexStyle(0,DRAW_LINE);
   SetIndexBuffer(0,CCIBuffer);
//---- name for DataWindow and indicator subwindow label
   short_name="JMA CCI("+CCIPeriod+")";
   IndicatorShortName(short_name);
   SetIndexLabel(0,short_name);
//----
   SetIndexDrawBegin(0,CCIPeriod);
//----
   return(0);
  }
//+------------------------------------------------------------------+
//| Commodity Channel Index                                          |
//+------------------------------------------------------------------+
int start()
  {
   int    i,k,counted_bars=IndicatorCounted();
   double price,sum,mul;
   if(Bars<=CCIPeriod) return(0);
//---- initial zero
   if(counted_bars<1)
     {
      for(i=1;i<=CCIPeriod;i++) CCIBuffer[Bars-i]=0.0;
      for(i=1;i<=CCIPeriod;i++) DevBuffer[Bars-i]=0.0;
      for(i=1;i<=CCIPeriod;i++) MovBuffer[Bars-i]=0.0;
     }
//---- last counted bar will be recounted
   int limit=Bars-counted_bars;
   if(counted_bars>0) limit++;
//---- moving average
   for(i=0; i<limit; i++)
      MovBuffer[i]=iCustom(NULL,0,"JMA",CCIPeriod,0,i);
      //MovBuffer[i]=iMA(NULL,0,CCIPeriod,0,MODE_SMA,PRICE_TYPICAL,i);
//---- standard deviations
   i=Bars-CCIPeriod+1;
   if(counted_bars>CCIPeriod-1) i=Bars-counted_bars-1;
   mul=0.015/CCIPeriod;
   while(i>=0)
     {
      sum=0.0;
      k=i+CCIPeriod-1;
      while(k>=i)
       {
         price=(High[k]+Low[k]+Close[k])/3;
         sum+=MathAbs(price-MovBuffer[i]);
         k--;
       }
      DevBuffer[i]=sum*mul;
      i--;
     }
   i=Bars-CCIPeriod+1;
   if(counted_bars>CCIPeriod-1) i=Bars-counted_bars-1;
   while(i>=0)
     {
      price=(High[i]+Low[i]+Close[i])/3;
      RelBuffer[i]=price-MovBuffer[i];
      i--;
     }
//---- cci counting
   i=Bars-CCIPeriod+1;
   if(counted_bars>CCIPeriod-1) i=Bars-counted_bars-1;
   while(i>=0)
     {
      if(DevBuffer[i]==0.0) CCIBuffer[i]=0.0;
      else CCIBuffer[i]=RelBuffer[i]/DevBuffer[i];
      i--;
     }
//----
   return(0);
  }
//+------------------------------------------------------------------+
Comments