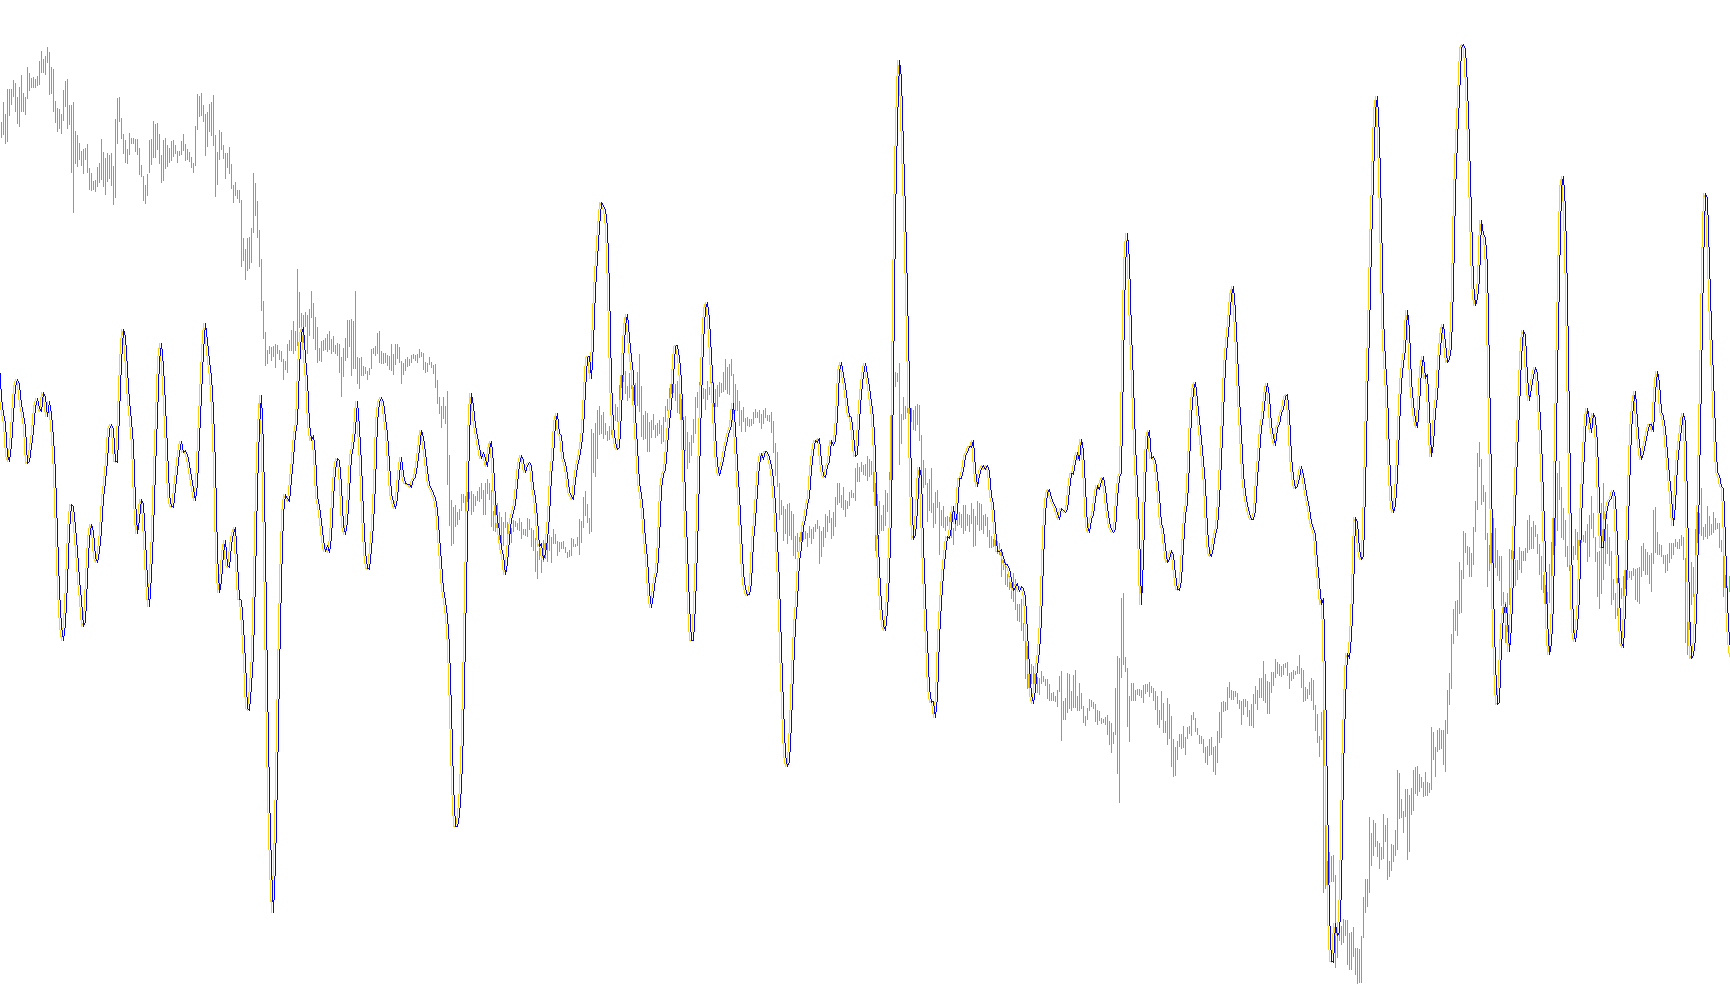
Overview
The CG Oscillator is a technical analysis tool designed to help traders identify trends and momentum in financial markets. Based on the "Cybernetics Analysis" methodology by John F. Ehlers, this script processes price data to create a visual oscillator that fluctuates around a center line, providing a clearer picture of market movement than raw price action alone.
Core Logic and Methodology
The indicator operates by analyzing the relationship between recent price points to determine the "weight" of current trends. Instead of simply looking at the latest price, it examines a specific window of time (defined by the user-set Length) to calculate a weighted average of price movement.
Here is how the underlying logic works:
- Price Sampling: The script first identifies the midpoint for each candle by averaging the highest and lowest prices reached during that period. This helps smooth out "noise" or erratic spikes caused by brief volatility.
- Weighted Calculation: Rather than treating all candles in the timeframe equally, the algorithm assigns a progressive weight to them. This means it gives more importance to the most recent data points while still considering the historical context of the preceding candles. By calculating the sum of these weighted values against the total sum of the values, the script determines a specific "position" for the current market state.
- Normalization: The resulting value is then mathematically adjusted so that it centers around a zero-point. This normalization allows traders to see whether the market is leaning toward an aggressive upward trend or a downward trend relative to its recent average.
- The Trigger Mechanism: In addition to the main CG line, the script generates a "Trigger" line. This represents the value of the preceding calculation. By comparing the current CG line against this trigger, traders can visually identify shifts in momentum—essentially seeing when the current trend begins to pull away from its immediate past.
Visual Representation
The indicator appears in a separate window below the main price chart, making it easy to monitor without cluttering the primary trading view. It produces two distinct lines:
- The CG Line: The primary oscillator showing the weighted momentum.
- The Trigger Line: A trailing reference point used to confirm trend changes or potential reversals.
By observing the relationship between these two lines and their position relative to the center zero-line, users can better understand market sentiment and identify potential entry or exit points based on cyclical trends.
//+------------------------------------------------------------------+
//|                                                           CG.mq4 |
//|                                                                  |
//| CG Oscillator                                                    |
//|                                                                  |
//| Algorithm taken from book                                        |
//|     "Cybernetics Analysis for Stock and Futures"                 |
//| by John F. Ehlers                                                |
//|                                                                  |
//|                                              contact@mqlsoft.com |
//|                                          http://www.mqlsoft.com/ |
//+------------------------------------------------------------------+
#property copyright "Coded by Witold Wozniak"
#property link      "www.mqlsoft.com"

#property indicator_separate_window
#property indicator_buffers 2
#property indicator_color1 Red
#property indicator_color2 Blue

#property indicator_level1 0

double CG[];
double Trigger[];

extern int Length = 10;
int buffers = 0;
int drawBegin = 0;

int init() {
    drawBegin = Length;
    initBuffer(CG, "CG", DRAW_LINE);
    initBuffer(Trigger, "Trigger", DRAW_LINE);
    IndicatorBuffers(buffers);
    IndicatorShortName("CG [" + Length + "]");
    return (0);
}

int start() {
    if (Bars <= drawBegin) return (0);
    int countedBars = IndicatorCounted();
    if (countedBars < 0) return (-1);
    if (countedBars > 0) countedBars--;
    int s, limit = Bars - countedBars - 1;
    for (s = limit; s >= 0; s--) {
        double Num = 0.0;
        double Denom = 0.0;
        for (int count = 0; count < Length; count++) {
            Num += (1.0 + count) * P(s + count);
            Denom += P(s + count);
        }
        if (Denom != 0) {
            CG[s] = -Num / Denom + (Length + 1.0) / 2.0;
        } else {
            CG[s] = 0;
        }
        Trigger[s] = CG[s + 1];
    }
    return (0);
}

double P(int index) {
    return ((High[index] + Low[index]) / 2.0);
}

void initBuffer(double array[], string label = "", int type = DRAW_NONE, int arrow = 0, int style = EMPTY, int width = EMPTY, color clr = CLR_NONE) {
    SetIndexBuffer(buffers, array);
    SetIndexLabel(buffers, label);
    SetIndexEmptyValue(buffers, EMPTY_VALUE);
    SetIndexDrawBegin(buffers, drawBegin);
    SetIndexShift(buffers, 0);
    SetIndexStyle(buffers, type, style, width);
    SetIndexArrow(buffers, arrow);
    buffers++;
}
Comments