ModifiedOptimumEllipticFilter
Download script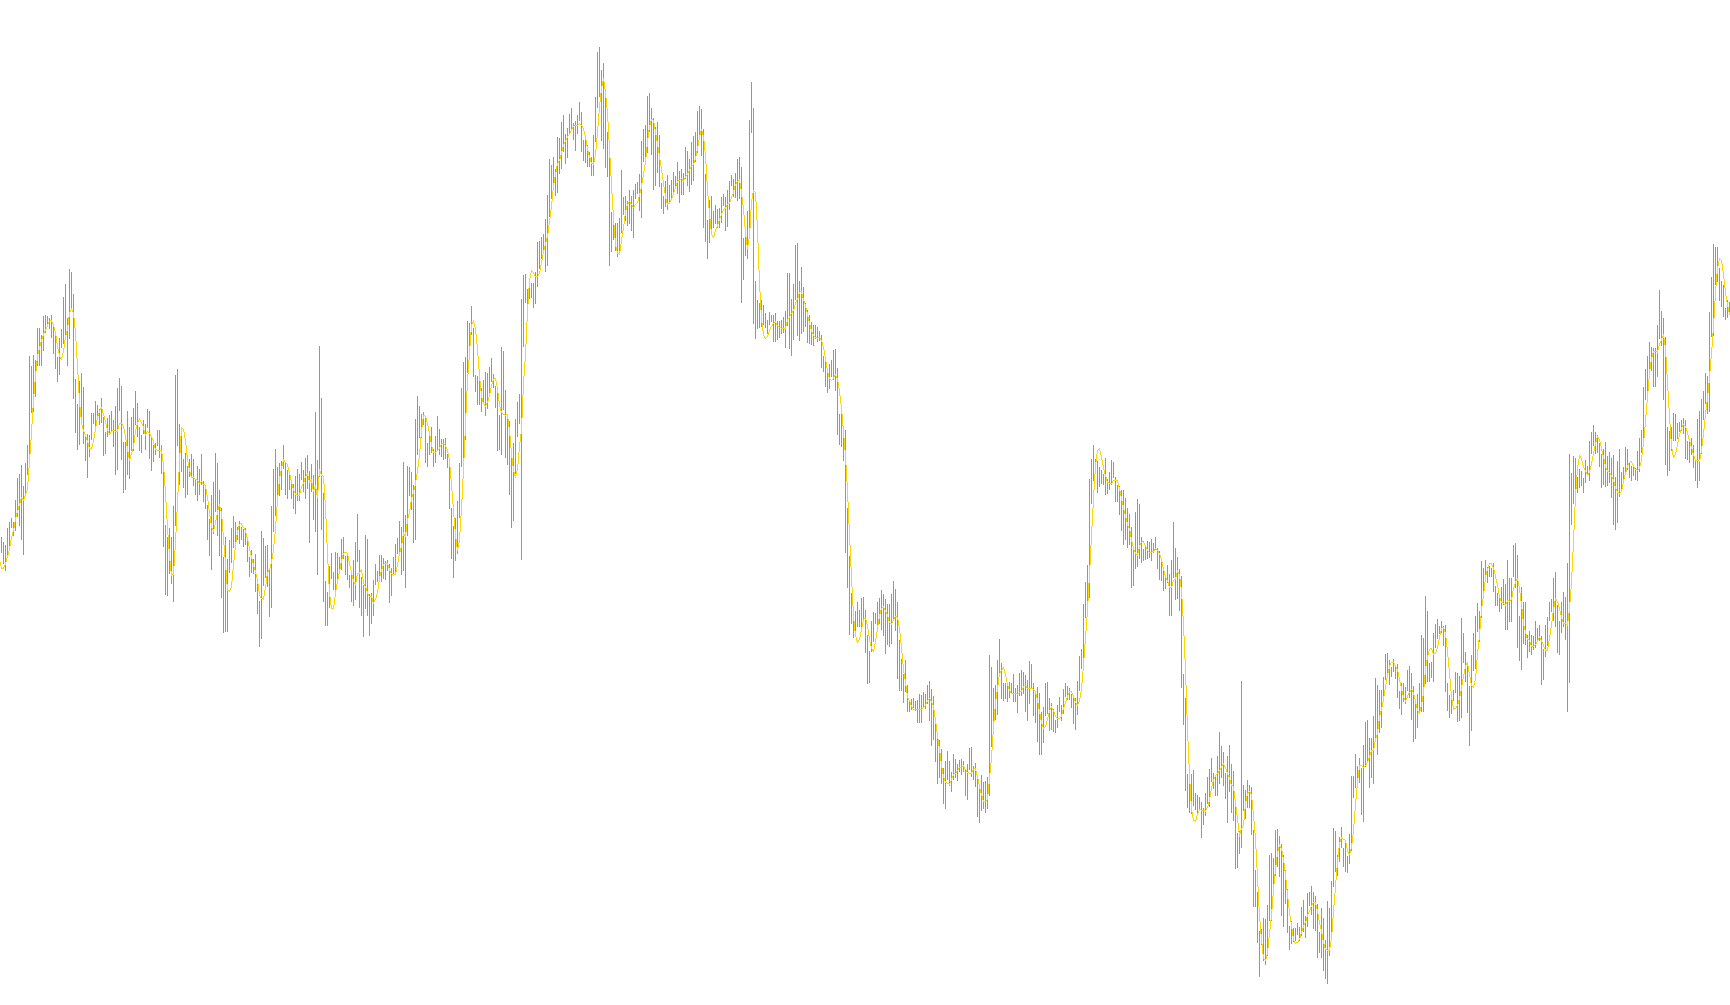
This script is a specialized technical analysis tool designed to smooth out price fluctuations and reveal underlying market trends. It utilizes a mathematical approach known as an "Elliptic Filter," which is engineered to reduce the "noise" typically found in volatile financial markets.
Core Logic and Functionality
The primary objective of this indicator is to provide a clearer picture of price action by filtering out minor, insignificant movements while maintaining the integrity of the overall trend. It achieves this through several logical steps:
1. Data Input Selection Rather than calculating values based on just the closing price, the script focuses on the midpoint of each period. By taking the average of the "High" and "Low" prices for every bar, the logic ensures that the indicator considers the full range of market activity during that time frame, leading to a more balanced representation of price.
2. Mathematical Smoothing (The Elliptic Filter) The heart of the script is a complex weighting formula. It looks back at recent price data points and applies specific mathematical coefficients to them. This creates a "weighted average" where:
- Recent price actions are factored in to keep the indicator responsive.
- Past data points are balanced against previous calculations to prevent the line from overreacting to sudden, temporary spikes or dips (outliers).
3. Recursive Trend Tracking The logic is "recursive," meaning it doesn't just look at what happened in the past; it uses its own previous results to determine its current position. By incorporating the smoothed value of the preceding bars into the current calculation, the indicator creates a continuous, fluid motion. This allows the red line on your chart to flow smoothly across the screen, making it easier for a trader to identify whether the market is trending upwards, downwards, or moving sideways.
Practical Application
For a user viewing this on a chart, the result is a distinct red line that follows the price action with a slight "buffer." Because it filters out the jittery movements of the market, it serves as a visual guide to help identify the dominant direction of the trend, helping traders distinguish between temporary market "noise" and actual sustained momentum.
//+------------------------------------------------------------------+
//|                                ModifiedOptimumEllipticFilter.mq4 |
//|                                                                  |
//| Code based on article:                                           |
//|     Stocks & Commodities V. 18:7 (20-29):                        |
//|     Optimal Detrending by John F. Ehlers                         |
//|                                                                  |
//|                                              contact@mqlsoft.com |
//|                                          http://www.mqlsoft.com/ |
//+------------------------------------------------------------------+
#property copyright "Coded by Witold Wozniak"
#property link      "www.mqlsoft.com"

#property indicator_chart_window
#property indicator_buffers 1
#property indicator_color1 Red

double smooth[];

int buffers = 0;
int drawBegin = 0;

int init() {
    drawBegin = 16;
    initBuffer(smooth, "MOEF", DRAW_LINE);
    IndicatorBuffers(buffers);
    IndicatorShortName("ModifiedOptimumEllipticFilter");
    return (0);
}

int start() {
    if (Bars <= drawBegin) return (0);
    int countedBars = IndicatorCounted();
    if (countedBars < 0) return (-1);
    if (countedBars > 0) countedBars--;
    int s, limit = Bars - countedBars - 1;
    for (s = limit; s >= 0; s--) {
        smooth[s] = 0.13785 * (2 * P(s) - P(s + 1))
                  + 0.0007  * (2 * P(s + 1) - P(s + 2))
                  + 0.13785 * (2 * P(s + 2) - P(s + 3))
                  + 1.2103  * smooth[s + 1] - 0.4867 * smooth[s + 2];
    }
    return (0);
}

double P(int index) {
    return ((High[index] + Low[index]) / 2.0);
}

void initBuffer(double array[], string label = "", int type = DRAW_NONE, int arrow = 0, int style = EMPTY, int width = EMPTY, color clr = CLR_NONE) {
    SetIndexBuffer(buffers, array);
    SetIndexLabel(buffers, label);
    SetIndexEmptyValue(buffers, EMPTY_VALUE);
    SetIndexDrawBegin(buffers, drawBegin);
    SetIndexShift(buffers, 0);
    SetIndexStyle(buffers, type, style, width);
    SetIndexArrow(buffers, arrow);
    buffers++;
}
Comments