Leading
Download script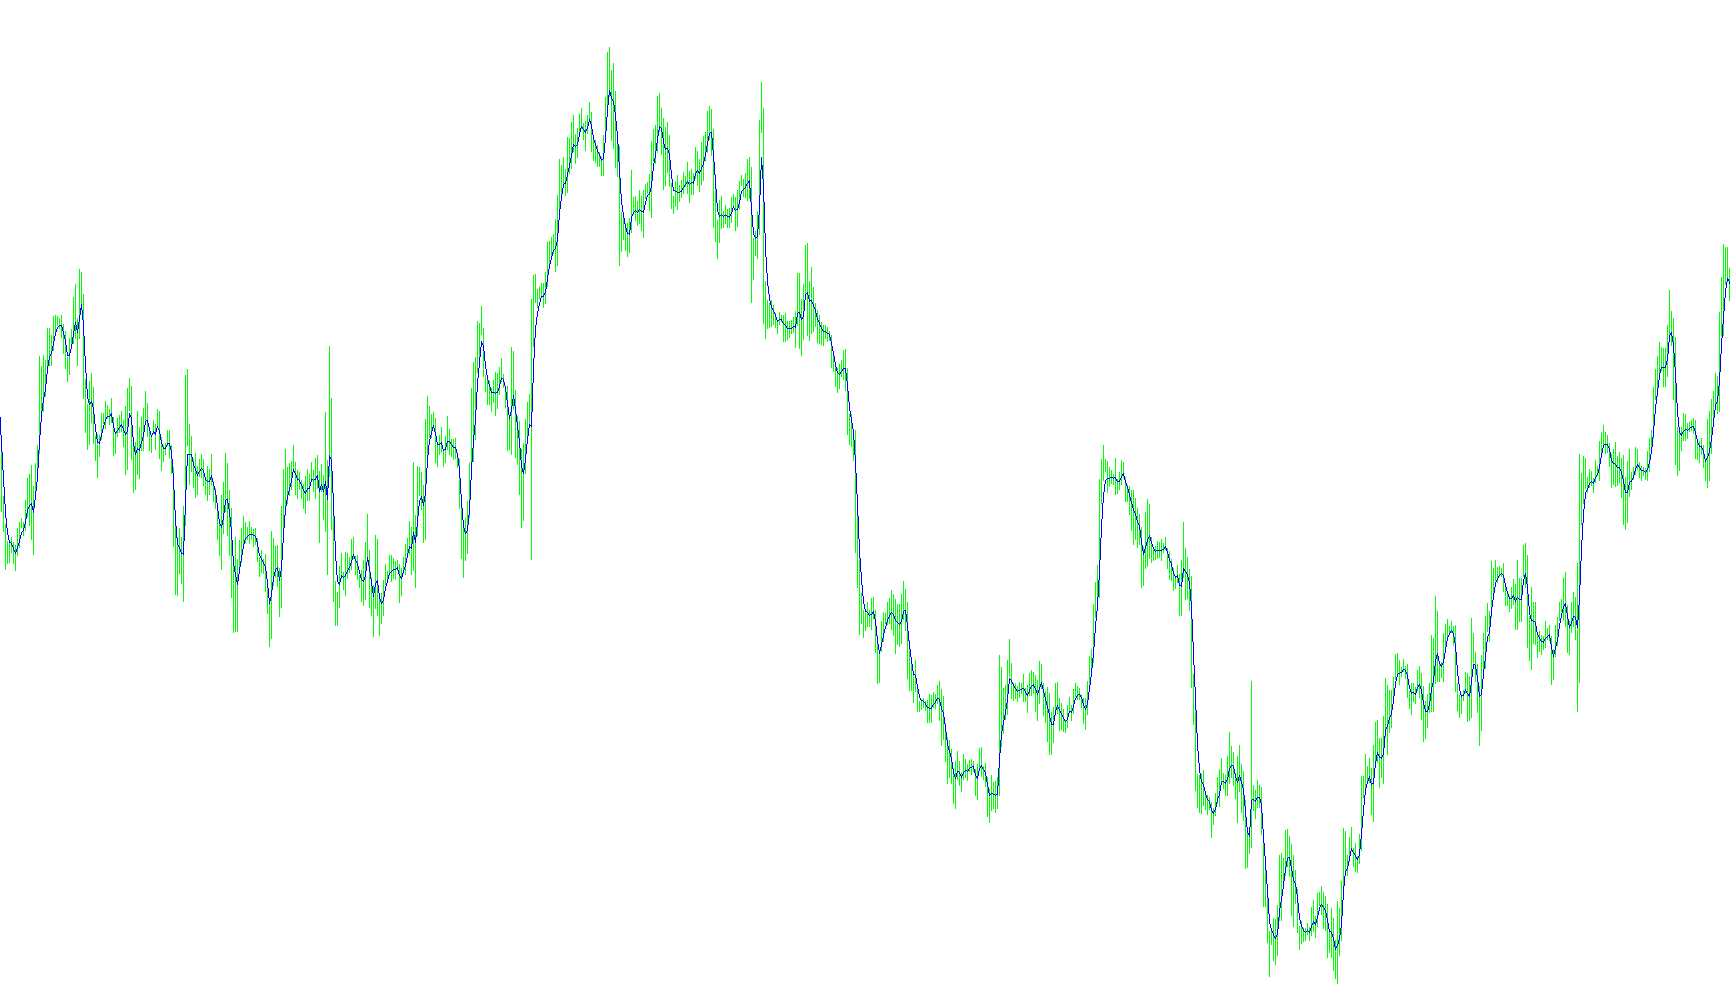
This indicator is designed to provide traders with a visual representation of price trends by identifying and smoothing out market noise. Based on the cybernetics principles outlined in John F. Ehlers' "Cybernetics Analysis for Stock and Futures," the script focuses on predicting potential price directions by analyzing the relationship between current price action and historical momentum.
Core Logic and Mechanics
The tool operates by processing three distinct layers of data to help a trader distinguish between actual trend shifts and temporary market fluctuations:
1. Price Midpoint Calculation Instead of looking only at the closing price, the script first calculates the midpoint of every candle (the average of the high and low prices). By using the midpoint, the indicator reduces the "noise" created by sudden spikes or wicks that don't represent a sustained change in sentiment.
2. The Leading Component The primary logic utilizes a mathematical formula to create a "Leading" value. This is achieved through a weighted calculation where the current price is balanced against its immediate predecessor and the previous leading value. This specific weighting is designed to anticipate where the price might move next, rather than simply reacting to where it has already been.
3. The Net Lead (Smoothing) To ensure the data is readable and not overly erratic, the script applies a secondary smoothing pass called the "Net Lead." This acts as a filter that stabilizes the leading component, creating a smoother curve that highlights the underlying trend of the market.
4. Exponential Moving Average (EMA) Comparison For context, the indicator also calculates a standard Exponential Moving Average. This serves as a benchmark for current price momentum. By comparing the "Net Lead" and the "Leading" values against this average, traders can visually assess whether the market is accelerating, decelerating, or moving in harmony with its historical average.
Visual Representation
The script outputs these calculations onto your chart as distinct lines. These lines are intended to help you identify trend direction more clearly than a raw price chart alone. When the leading values align and smooth out in a specific direction, it suggests a stronger commitment to that trend; when they diverge or become erratic, it may signal a period of consolidation or a shift in market dynamics.
//+------------------------------------------------------------------+
//|                                                      Leading.mq4 |
//|                                                                  |
//| Leading                                                          |
//|                                                                  |
//| Algorithm taken from book                                        |
//|     "Cybernetics Analysis for Stock and Futures"                 |
//| by John F. Ehlers                                                |
//|                                                                  |
//|                                              contact@mqlsoft.com |
//|                                          http://www.mqlsoft.com/ |
//+------------------------------------------------------------------+
#property copyright "Coded by Witold Wozniak"
#property link      "www.mqlsoft.com"

#property indicator_chart_window
#property indicator_buffers 2
#property indicator_color1 Red
#property indicator_color2 Blue

extern double Alpha1 = 0.25;
extern double Alpha2 = 0.33;

double NetLead[];
double Lead[];
double EMA[];

int buffers = 0;
int drawBegin = 0;

int init() {
    drawBegin = 16;
    initBuffer(NetLead, "Lead", DRAW_LINE);
    initBuffer(EMA, "EMA", DRAW_LINE);
    initBuffer(Lead);
    IndicatorBuffers(buffers);
    IndicatorShortName("Leading [" + DoubleToStr(Alpha1, 2) + ", " + DoubleToStr(Alpha2, 2) + "]");
    return (0);
}


int start() {
    if (Bars <= drawBegin) return (0);
    int countedBars = IndicatorCounted();
    if (countedBars < 0) return (-1);
    if (countedBars > 0) countedBars--;
    int s, limit = Bars - countedBars - 1;
    for (s = limit; s >= 0; s--) {
        Lead[s] = 2.0 * P(s) + (Alpha1 - 2.0) * P(s + 1) + (1.0 - Alpha1) * Lead[s + 1];
        NetLead[s] = Alpha2 * Lead[s] + (1 - Alpha2) * NetLead[s + 1];
        EMA[s] = 0.5 * P(s) + 0.5 * EMA[s + 1];
    }
    return (0);
}

double P(int index) {
    return ((High[index] + Low[index]) / 2.0);
}

void initBuffer(double array[], string label = "", int type = DRAW_NONE, int arrow = 0, int style = EMPTY, int width = EMPTY, color clr = CLR_NONE) {
    SetIndexBuffer(buffers, array);
    SetIndexLabel(buffers, label);
    SetIndexEmptyValue(buffers, EMPTY_VALUE);
    SetIndexDrawBegin(buffers, drawBegin);
    SetIndexShift(buffers, 0);
    SetIndexStyle(buffers, type, style, width);
    SetIndexArrow(buffers, arrow);
    buffers++;
}
Comments