CoeffoLine_Hist
Download script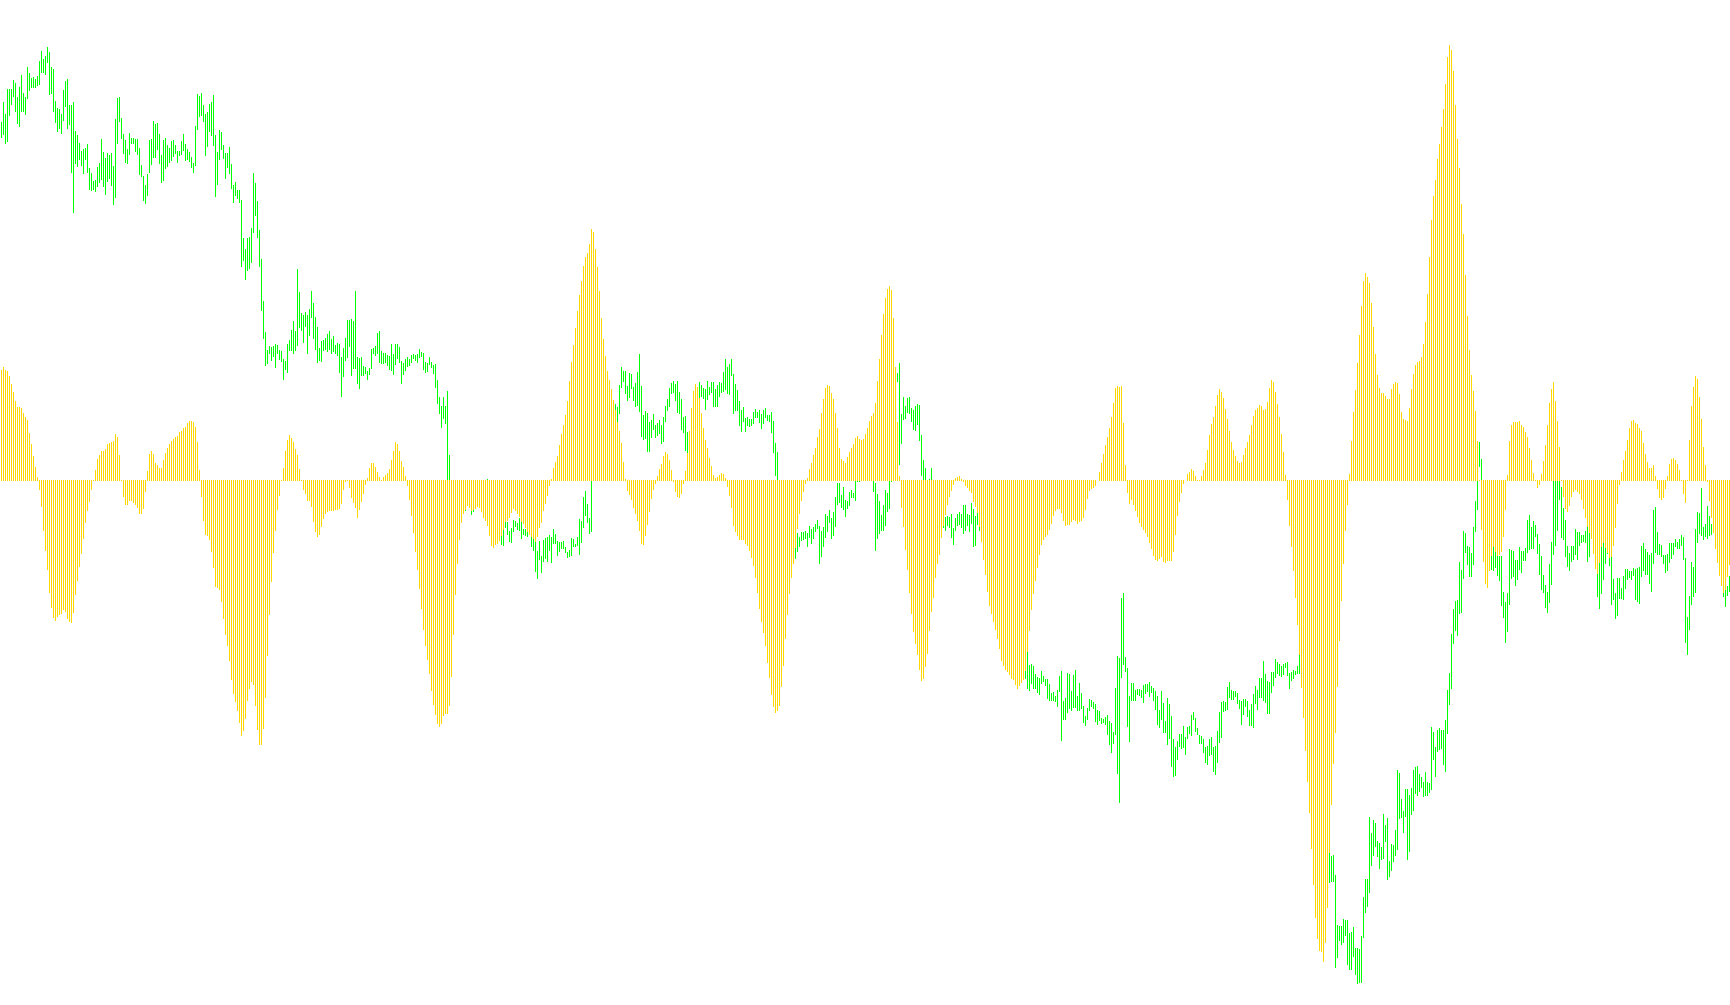
This script functions as a specialized visual tool designed to analyze price movement trends by comparing two different types of mathematical averages. It generates a historical histogram that helps traders visualize the relationship between raw price data and smoothed trend indicators.
Core Logic Overview
The primary goal of this script is to calculate a "Coefficient Line." It achieves this by looking at a specific window of past price bars (determined by the user) and performing a weighted comparison between two distinct variables:
- Raw Price Analysis: The script looks at the "Median Price" (the midpoint between the highest and lowest price) over a set period. It applies a weight to these prices, giving different importance to data points based on their position in time.
- Smoothed Trend Analysis: Simultaneously, the script calculates a Moving Average (specifically a Smoothed Moving Average). This provides a "buffer" or a cleaned-up version of the price action, filtering out minor market noise.
How the Calculation Works
The script performs several mathematical operations to arrive at its final result:
- Weighted Averaging: It doesn't just take a simple average; it uses a weighted formula (calculating sums of squares and linear values) to ensure that the data points are processed in a way that highlights specific momentum characteristics.
- Ratio Comparison: It calculates a ratio between the weighted raw price and the smoothed moving average.
- Logarithmic Scaling: To make this information readable as a visible chart, the script converts that ratio into a logarithmic value. This allows for a more balanced visual representation of whether the price is pulling away from its average or returning toward it.
Dynamic Adjustment
The script includes a specific logic gate for currency pairs. It checks which asset is currently being viewed (such as EURUSD, GBPUSD, etc.). Depending on the specific currency pair, it adjusts the direction of the final calculation (flipping the sign). This ensures that the histogram accurately reflects the price behavior regardless of the specific market's characteristics.
Visual Output
The end result is a Red Histogram displayed in a separate window at the bottom of your trading platform. Instead of showing the price itself, this histogram represents the "coefficient"—a measurement of the divergence or convergence between the current price momentum and its historical smoothed trend.
//+------------------------------------------------------------------+
//| CoeffoLine_Hist.mq4
//| Ramdass - Conversion only
//+------------------------------------------------------------------+

#property indicator_separate_window
#property indicator_buffers 1
#property indicator_color1 Red


extern int ndot=30;
extern int CountBars=10000;
//---- buffers
double cfl[];


//+------------------------------------------------------------------+
//| Custom indicator initialization function                         |
//+------------------------------------------------------------------+
int init()
  {
   string short_name;
//---- indicator line
   IndicatorBuffers(1);
   SetIndexStyle(0,DRAW_HISTOGRAM);
   SetIndexBuffer(0,cfl);
//----
   return(0);
  }
//+------------------------------------------------------------------+
//| CoeffofLine_v1                                                              |
//+------------------------------------------------------------------+
int start()
  {


   if (CountBars>=Bars) CountBars=Bars;
   SetIndexDrawBegin(0,Bars-CountBars+ndot+1);
   int i,shift,cnt,ndot1,counted_bars=IndicatorCounted();
   double TYVar,ZYVar,TIndicatorVar,ZIndicatorVar,M,N,AY,AIndicator;
//----
   if(Bars<=ndot) return(0);

//----
   shift=CountBars-ndot-1;


   while(shift>=0)
     {

   TYVar=0;
	ZYVar=0;
	N=0;
	M=0;
	TIndicatorVar=0;
	ZIndicatorVar=0;
	ndot1=ndot;
	if (shift+1<ndot1) ndot1=shift+1;
	for (cnt=ndot; cnt>=1; cnt--) // n=5 -  ïî ïÿòè òî÷êàì
	{
		N=N+cnt*cnt;  //ðàâíî 55
		M=M+cnt;      //ðàâíî 15
	}
	for (cnt=ndot1; cnt>=1; cnt--) // n=5 -  ïî ïÿòè òî÷êàì
	{
		ZYVar=ZYVar+(High[shift-cnt+1]+Low[shift-cnt+1])/2*(ndot+1-cnt);
		TYVar=TYVar+(High[shift-cnt+1]+Low[shift-cnt+1])/2;
		ZIndicatorVar=ZIndicatorVar+iMA(NULL,0,5,3,MODE_SMMA,PRICE_MEDIAN,shift-cnt+1)*(ndot+1-cnt);
		TIndicatorVar=TIndicatorVar+iMA(NULL,0,5,3,MODE_SMMA,PRICE_MEDIAN,shift-cnt+1);
	}
	AY=(TYVar+(N-2*ZYVar)*ndot/M)/M;
	AIndicator=(TIndicatorVar+(N-2*ZIndicatorVar)*ndot/M)/M;
	if (Symbol()=="EURUSD" || Symbol()=="GBPUSD" || Symbol()=="USDCAD" || Symbol()=="USDCHF"
	 || Symbol()=="EURGBP" || Symbol()=="EURCHF" || Symbol()=="AUDUSD"
	 || Symbol()=="GBPCHF")
	{cfl[shift]=(-1000)*MathLog(AY/AIndicator);}
	else {cfl[shift]=(1000)*MathLog(AY/AIndicator);}


      shift--;
     }
   return(0);
  }
//+------------------------------------------------------------------+
Comments