CoeffoLine_Hist1_v1
Download script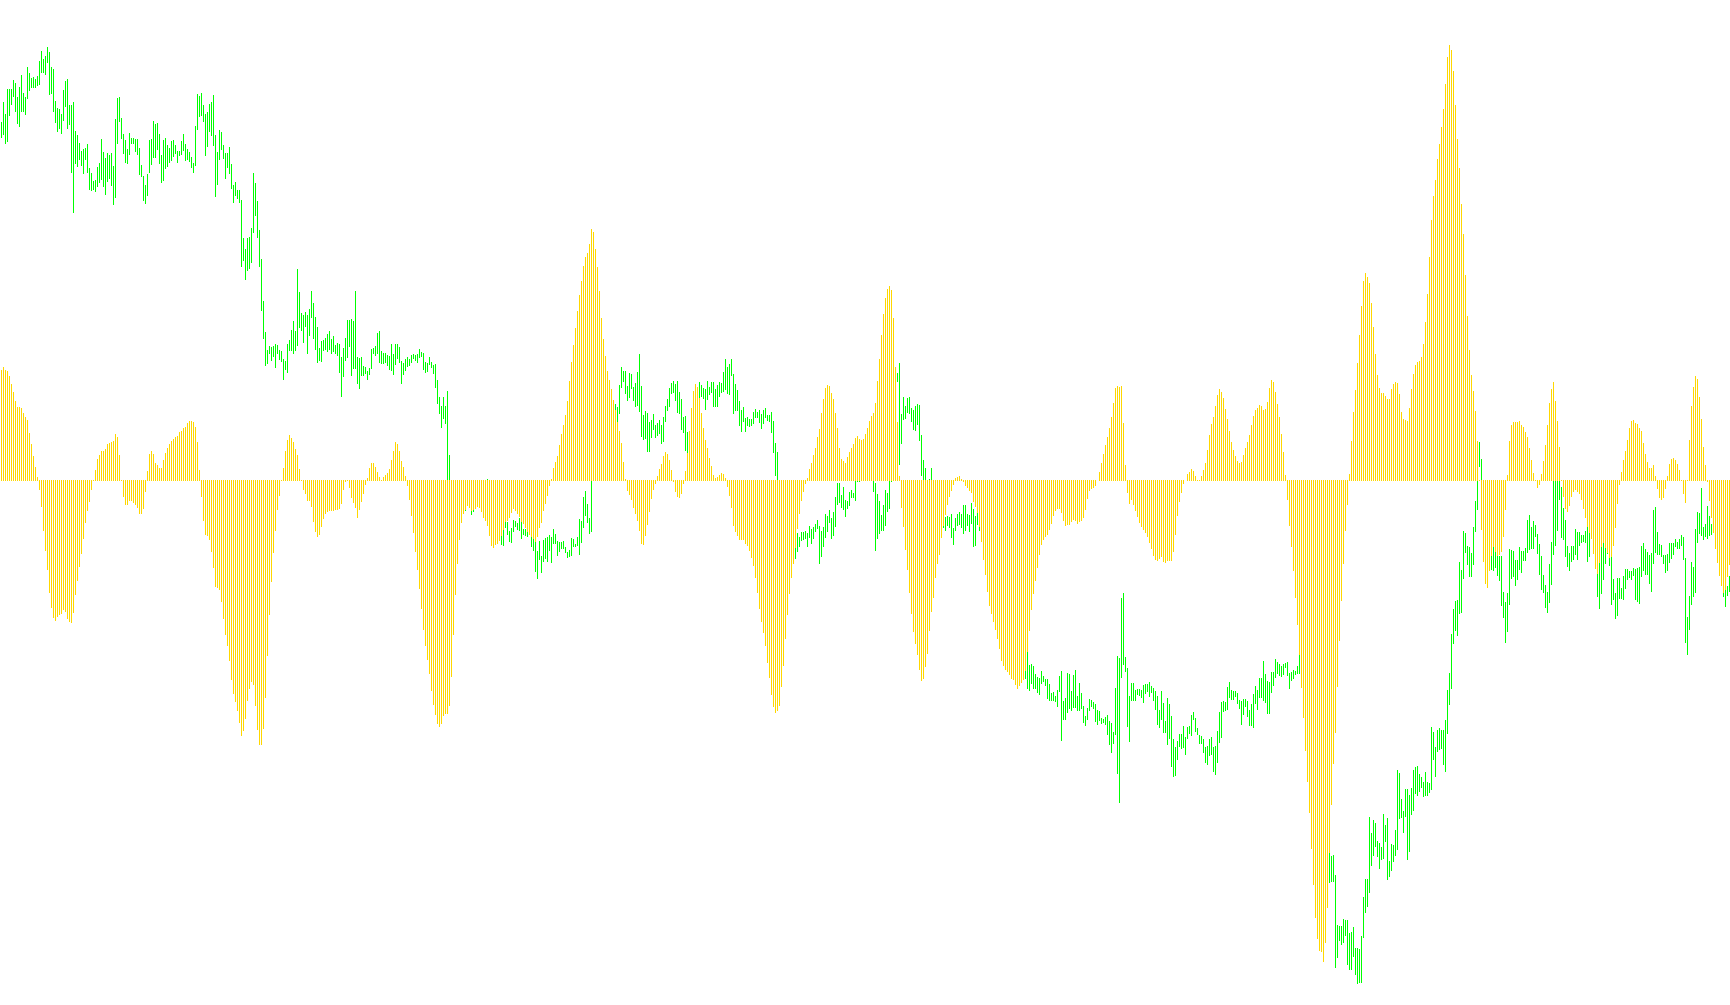
This technical tool is designed to analyze price action by calculating the relationship between two different types of moving averages. It creates a visual representation (a histogram) that helps traders identify specific market dynamics, particularly by measuring the "coefficient" or discrepancy between raw price movements and smoothed trend data.
How the Logic Works
The script operates by performing a multi-step mathematical evaluation on historical price data:
1. Data Point Calculation The tool looks back at a specific number of bars (set by the user) to analyze the high and low prices of the currency pair. It specifically focuses on the "median" price—the midpoint between the highest and lowest price reached during each period.
2. Comparative Analysis The logic runs two parallel calculations simultaneously:
- Raw Price Dynamics: It calculates a weighted value based on the actual market highs and lows over a set period.
- Smoothed Trend Dynamics: It calculates a similar value using a smoothed moving average (specifically a Smoothed Moving Average or SMMA).
3. The Coefficient Calculation By comparing these two different types of data points, the script determines a ratio. It essentially measures how much the current price action deviates from its established trend. This "Coefficient of Line" highlights whether the market is reacting aggressively compared to its historical average.
4. Currency-Specific Adjustments The tool includes a unique logic gate that detects which currency pair you are trading. For major pairs (such as EURUSD, GBPUSD, USDCAD, etc.), it applies one mathematical formula to the result. For all other currency pairs, it flips the polarity of the calculation. This ensures that the resulting histogram remains visually consistent and meaningful across different markets.
5. Visual Output The final result is plotted as a red histogram in a separate window. Instead of showing the price of the currency, it shows the intensity of the relationship between price volatility and trend smoothing. Large movements in this histogram suggest significant shifts or momentum changes in the underlying market.
/*-----------------------------+
|			       |
| Shared by www.Aptrafx.com    |
|			       |
+------------------------------*/

//+------------------------------------------------------------------+
//|                                                  CoeffofLine.mq4 |
//|                                        Ramdass - Conversion only |
//+------------------------------------------------------------------+

#property indicator_separate_window
#property indicator_buffers 1
#property indicator_color1 Red

extern int ndot=30;
extern int CountBars=10000;
//---- buffers
double cfl[];

//+------------------------------------------------------------------+
//| Custom indicator initialization function                         |
//+------------------------------------------------------------------+
int init()
  {
   string short_name;
//---- indicator line
   IndicatorBuffers(1);
   SetIndexStyle(0,DRAW_HISTOGRAM);
   SetIndexBuffer(0,cfl);
//----
   return(0);
  }
//+------------------------------------------------------------------+
//| CoeffofLine_v1                                                              |
//+------------------------------------------------------------------+
int start()
  {

   if (CountBars>=Bars) CountBars=Bars;
   SetIndexDrawBegin(0,Bars-CountBars+ndot+1);
   int i,shift,cnt,ndot1,counted_bars=IndicatorCounted();
   double TYVar,ZYVar,TIndicatorVar,ZIndicatorVar,M,N,AY,AIndicator;
//----
   if(Bars<=ndot) return(0);

//----
   shift=CountBars-ndot-1;


   while(shift>=0)
      {

      TYVar=0;
	   ZYVar=0;
	   N=0;
   	M=0;
	   TIndicatorVar=0;
	   ZIndicatorVar=0;
	   ndot1=ndot;
	   if (shift+1<ndot1) ndot1=shift+1;
	      for (cnt=ndot; cnt>=1; cnt--)
            {
		      N=N+cnt*cnt;
		      M=M+cnt;
	         }
	      for (cnt=ndot1; cnt>=1; cnt--)
            {
		      ZYVar=ZYVar+(High[shift-cnt+1]+Low[shift-cnt+1])/2*(ndot+1-cnt);
		      TYVar=TYVar+(High[shift-cnt+1]+Low[shift-cnt+1])/2;
		      ZIndicatorVar=ZIndicatorVar+iMA(NULL,0,5,3,MODE_SMMA,PRICE_MEDIAN,shift-cnt+1)*(ndot+1-cnt);
		      TIndicatorVar=TIndicatorVar+iMA(NULL,0,5,3,MODE_SMMA,PRICE_MEDIAN,shift-cnt+1);
	         }
         AY=(TYVar+(N-2*ZYVar)*ndot/M)/M;
	      AIndicator=(TIndicatorVar+(N-2*ZIndicatorVar)*ndot/M)/M;
      	if (Symbol()=="EURUSD" || Symbol()=="GBPUSD" || Symbol()=="USDCAD" || Symbol()=="USDCHF"
	           || Symbol()=="EURGBP" || Symbol()=="EURCHF" || Symbol()=="AUDUSD"
	           || Symbol()=="GBPCHF")
         	{cfl[shift]=(-1000)*MathLog(AY/AIndicator);}
	      else {cfl[shift]=(1000)*MathLog(AY/AIndicator);}
      shift--;
      }
   return(0);
   }
//+------------------------------------------------------------------+
Comments