CoeffoLine_Hist_v1
Download script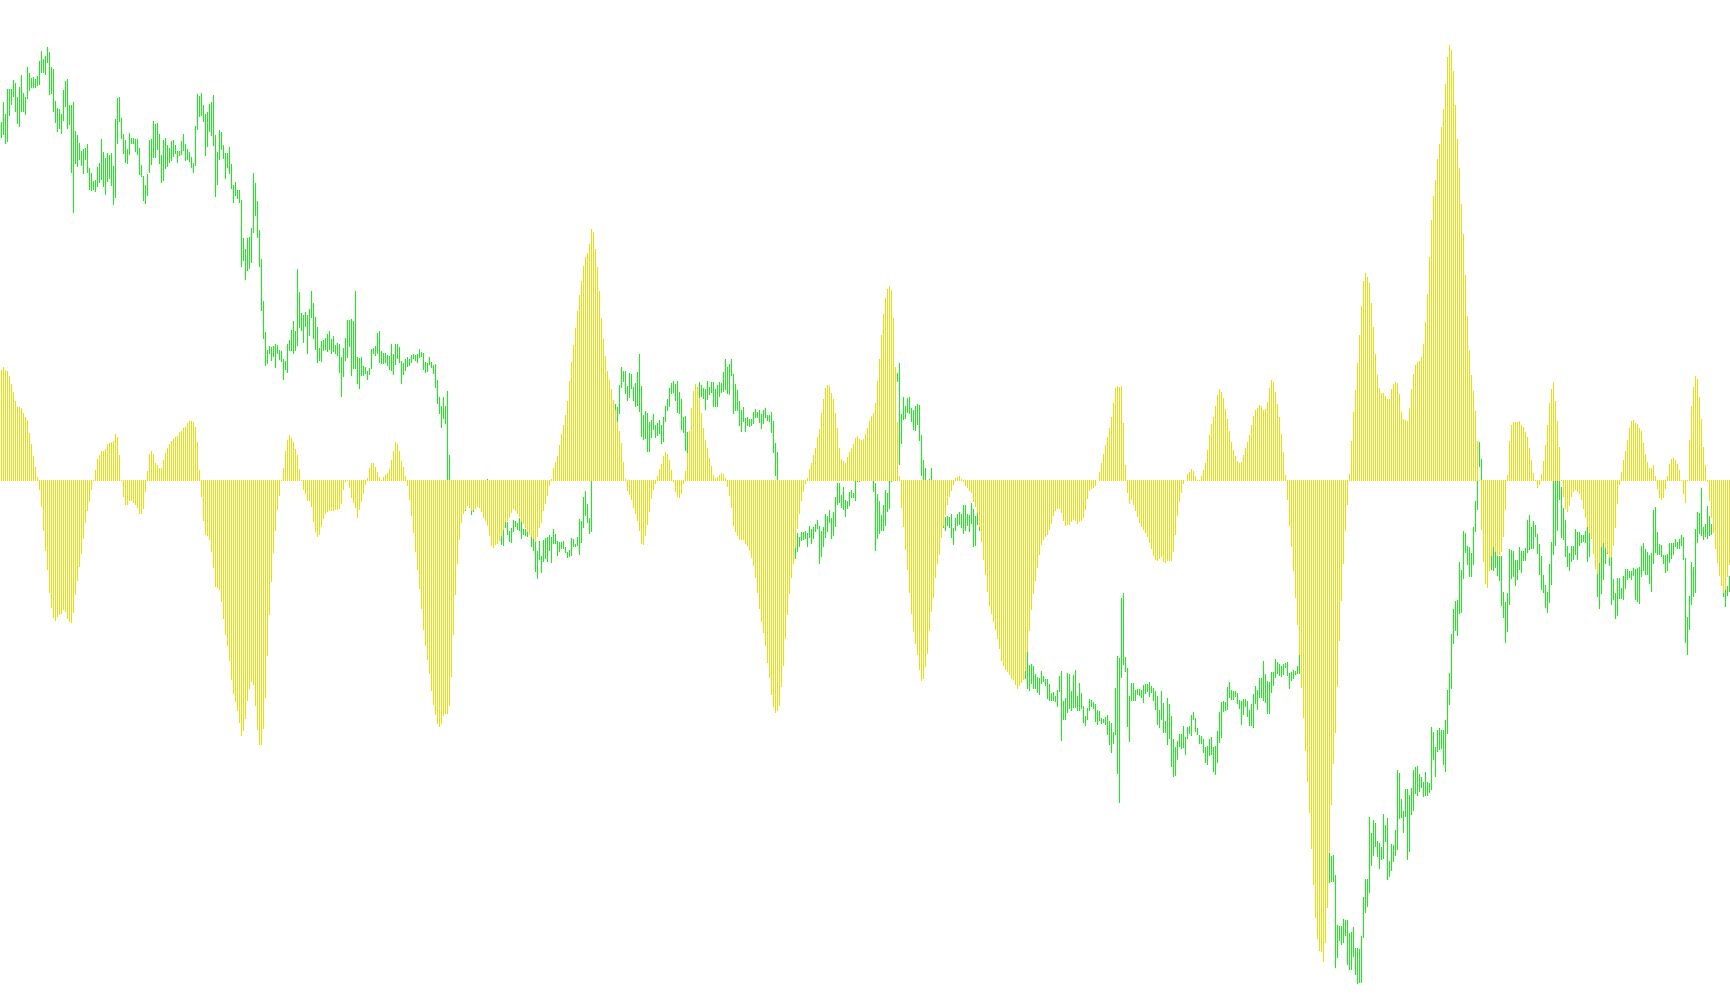
This technical indicator is designed to analyze market trends by calculating and comparing two distinct types of price movement averages. Its primary purpose is to measure the relationship between these two values to identify momentum, volatility, or potential shifts in the market direction.
How the Logic Works
1. Data Selection and Smoothing The tool starts by looking at a specific window of historical price data (defined by a user-set number of points). Within this window, it calculates the "Median Price" for each bar—which is the halfway point between the high and low prices. It then applies two different mathematical filters to these prices:
- Standard Smoothing: A standard moving average that follows the price closely.
- Weighted Smoothing: A weighted approach where more recent price points are given different significance than older ones, helping to distinguish between noise and actual trend movement.
2. The Comparative Calculation The core logic of the script relies on comparing these two smoothed averages against one another. By creating two separate "profiles" of the price action—one reacting quickly and one reacting with a heavier weight—the script can determine the "Coefficient of Line."
Essentially, it looks at how much the weighted average deviates from the standard average. If the price is moving strongly in one direction, these two lines will diverge; if the market isranging or flat, they will remain closely aligned.
3. Logarithmic Scaling and Output To make this data useful for visual analysis, the script converts the difference between these two averages into a logarithmic scale. This transformation "flattens" extreme price spikes and makes it easier to see subtle changes in trend strength that might be missed by looking at raw price bars alone.
4. Currency-Specific Adjustment The logic includes a unique automatic adjustment for specific major currency pairs (such as EURUSD, GBPUSD, and others). Depending on the specific symbol you are trading, the script automatically flips the orientation of the resulting histogram. This ensures that the visual data aligns correctly with the natural behavior of those specific markets, providing a consistent visual signal regardless of which major pair is being viewed.
Visual Representation
The final output is displayed as a histogram in a separate window on your chart. Instead of showing price levels, it shows the "strength" or "coefficient" of the trend. A shift in the histogram's direction or height provides a visual cue regarding the momentum and the relationship between short-term price action and long-term weighted trends.
/*-----------------------------+
|			       |
| Shared by www.Aptrafx.com    |
|			       |
+------------------------------*/

//compile//
//+------------------------------------------------------------------+
//| CoeffofLine.mq4
//| Ramdass - Conversion only
//+------------------------------------------------------------------+

#property indicator_separate_window
#property indicator_buffers 1
#property indicator_color1 Red


extern int ndot=30;
extern int CountBars=10000;
//---- buffers
double cfl[];


//+------------------------------------------------------------------+
//| Custom indicator initialization function                         |
//+------------------------------------------------------------------+
int init()
  {
   string short_name;
//---- indicator line
   IndicatorBuffers(1);
   SetIndexStyle(0,DRAW_HISTOGRAM);
   SetIndexBuffer(0,cfl);
//----
   return(0);
  }
//+------------------------------------------------------------------+
//| CoeffofLine_v1                                                              |
//+------------------------------------------------------------------+
int start()
  {


   if (CountBars>=Bars) CountBars=Bars;
   SetIndexDrawBegin(0,Bars-CountBars+ndot+1);
   int i,shift,cnt,ndot1,counted_bars=IndicatorCounted();
   double TYVar,ZYVar,TIndicatorVar,ZIndicatorVar,M,N,AY,AIndicator;
//----
   if(Bars<=ndot) return(0);

//----
   shift=CountBars-ndot-1;


   while(shift>=0)
     {

   TYVar=0;
	ZYVar=0;
	N=0;
	M=0;
	TIndicatorVar=0;
	ZIndicatorVar=0;
	ndot1=ndot;
	if (shift+1<ndot1) ndot1=shift+1;
	for (cnt=ndot; cnt>=1; cnt--) // n=5 -  ïî ïÿòè òî÷êàì
	{
		N=N+cnt*cnt;  //ðàâíî 55
		M=M+cnt;      //ðàâíî 15
	}
	for (cnt=ndot1; cnt>=1; cnt--) // n=5 -  ïî ïÿòè òî÷êàì
	{
		ZYVar=ZYVar+(High[shift-cnt+1]+Low[shift-cnt+1])/2*(ndot+1-cnt);
		TYVar=TYVar+(High[shift-cnt+1]+Low[shift-cnt+1])/2;
		ZIndicatorVar=ZIndicatorVar+iMA(NULL,0,5,3,MODE_SMMA,PRICE_MEDIAN,shift-cnt+1)*(ndot+1-cnt);
		TIndicatorVar=TIndicatorVar+iMA(NULL,0,5,3,MODE_SMMA,PRICE_MEDIAN,shift-cnt+1);
	}
	AY=(TYVar+(N-2*ZYVar)*ndot/M)/M;
	AIndicator=(TIndicatorVar+(N-2*ZIndicatorVar)*ndot/M)/M;
	if (Symbol()=="EURUSD" || Symbol()=="GBPUSD" || Symbol()=="USDCAD" || Symbol()=="USDCHF"
	 || Symbol()=="EURGBP" || Symbol()=="EURCHF" || Symbol()=="AUDUSD"
	 || Symbol()=="GBPCHF")
	{cfl[shift]=(-1000)*MathLog(AY/AIndicator);}
	else {cfl[shift]=(1000)*MathLog(AY/AIndicator);}


      shift--;
     }
   return(0);
  }
//+------------------------------------------------------------------+
Comments