DECEMA_v1_v1
Download script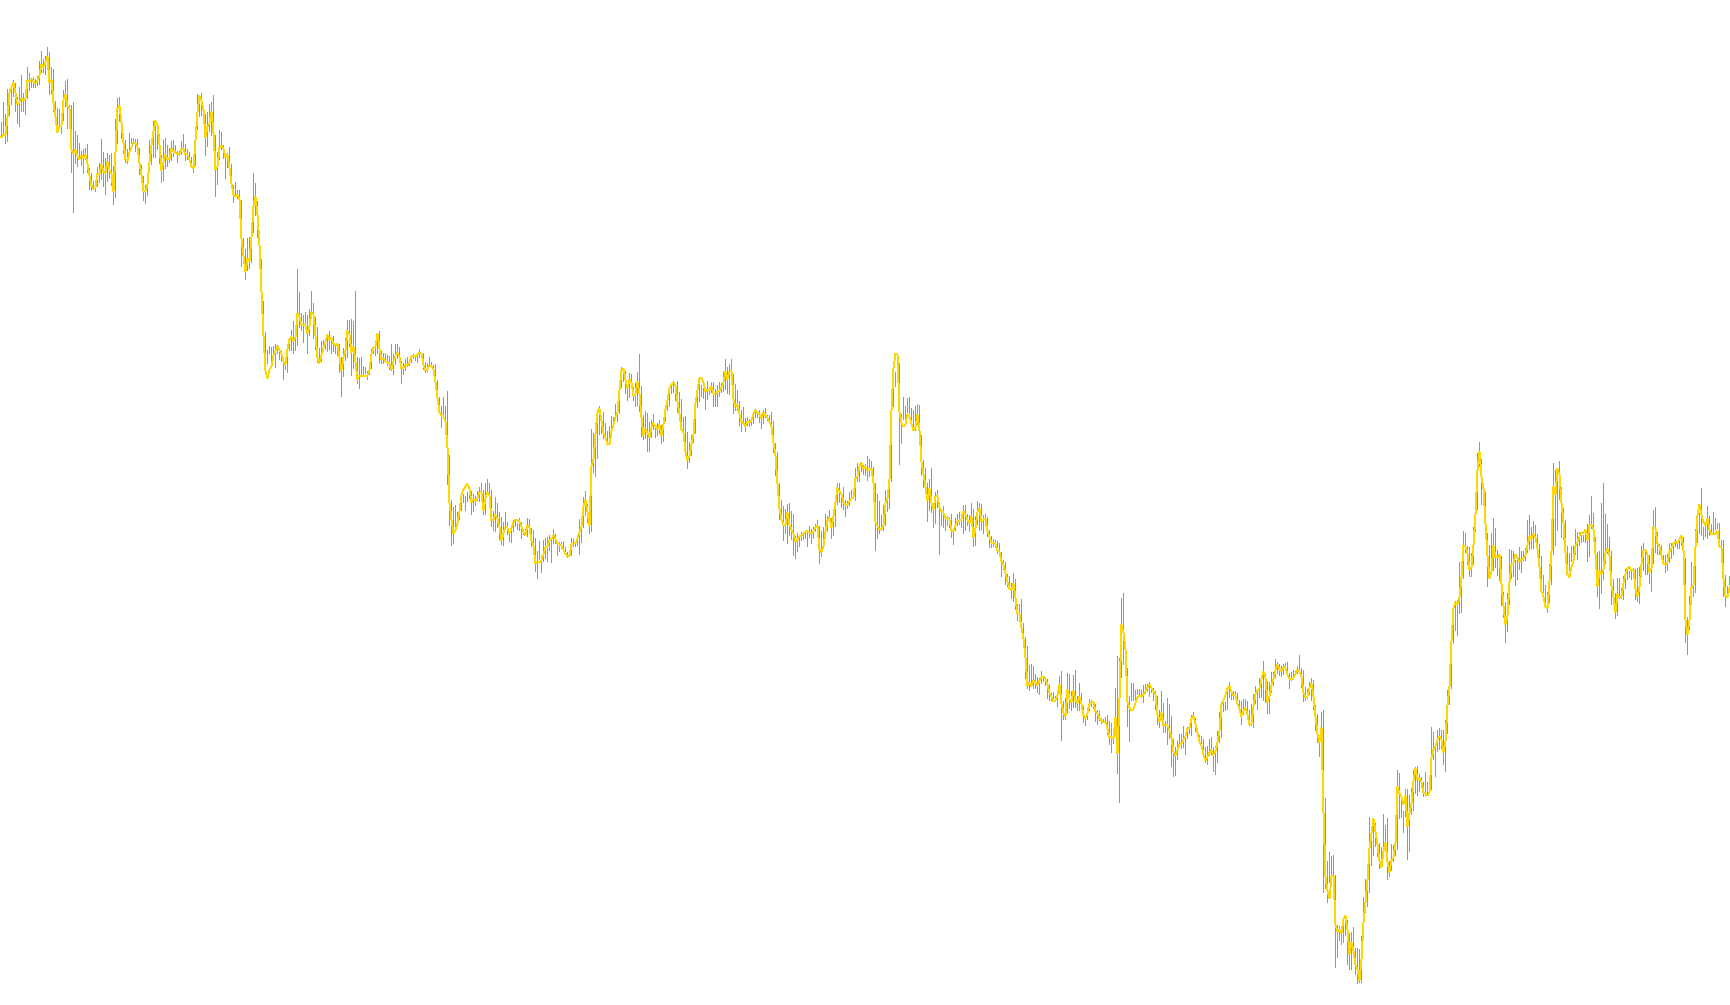
The DECEMA script is a specialized technical analysis indicator designed to provide traders with a smoothed, high-precision moving average on a price chart. Unlike standard moving averages that may react too quickly to market "noise" or lag significantly behind actual price movements, this tool uses a multi-layered mathematical approach to achieve a balance between responsiveness and stability.
How the Logic Works
1. Multi-Layered Smoothing (The "Decema" Chain) Instead of calculating a single average based on historical prices, the script creates a chain of ten interconnected calculations. It begins by taking a standard simple moving average as a base input and then passes that result through nine subsequent layers of processing. Each layer takes the output of the previous one and blends it with its own previous value using a specific weighting factor (referred to as "alpha").
This creates a "compounding" effect:
- The first layer provides a basic smoothing.
- Each subsequent layer (from 2 through 10) acts as an additional filter, progressively removing price fluctuations and erratic spikes.
2. The Weighted Calculation Once the script has generated these ten distinct smoothed values, it applies a sophisticated weighted formula to them. Rather than simply averaging the final results, it assigns specific multipliers to each of the ten layers. This specific distribution allows the indicator to prioritize certain smoothing depths over others, creating a unique curve that identifies the underlying trend more clearly than a conventional Exponential Moving Average (EMA) could on its own.
3. Real-Time Processing The script is designed to run dynamically on your chart. It constantly monitors new price data and recalculates the entire ten-layer chain as each new candle forms. It also includes "memory" logic to ensure that historical data remains consistent; it stores previous values to ensure that the transition from past data to present data remains seamless and accurate.
Summary for Traders
In practical terms, this script acts as a trend-filtering tool. Because it passes the price through ten layers of smoothing before displaying the final line on your chart, it is highly effective at "cleaning" the chart of minor price fluctuations. It is designed to help traders identify the core direction of the market, providing a smoother path that helps in identifying sustained momentum while ignoring temporary volatility.
//+------------------------------------------------------------------+
//|                                                       DECEMA.mq4 |
//|                                         Developed by Coders Guru |
//|                                            http://www.xpworx.com |
//|
//|                         Revised by IgorAD,igorad2003@yahoo.co.uk |
//|                                        http://www.forex-tsd.com/ |
//+------------------------------------------------------------------+
#property link      "http://www.xpworx.com"
//----
#property indicator_chart_window
#property indicator_buffers 1
#property indicator_color1 Red
//----
extern   int      MA_Period                 =15;
extern   int      MA_Price                  =PRICE_CLOSE;
//----
double DrawEMA[];
double EMA1, EMA2, EMA3, EMA4, EMA5, EMA6, EMA7, EMA8, EMA9, EMA10;
int time2;
double bEMA1, bEMA2, bEMA3, bEMA4, bEMA5, bEMA6, bEMA7, bEMA8, bEMA9, bEMA10;
double alfa;
//+------------------------------------------------------------------+
//|                                                                  |
//+------------------------------------------------------------------+
int init()
  {
   SetIndexStyle(0,DRAW_LINE, STYLE_SOLID,2);
   SetIndexBuffer(0,DrawEMA);
   string short_name="DECEMA("+MA_Period+")";
   IndicatorShortName(short_name);
   SetIndexDrawBegin(0,10*MA_Period);
   alfa=2.0/(1.0+MA_Period);
   return(0);
  }
//+------------------------------------------------------------------+
//|                                                                  |
//+------------------------------------------------------------------+
int deinit()
  {
   return(0);
  }
//+------------------------------------------------------------------+
//|                                                                  |
//+------------------------------------------------------------------+
void start()
  {
   int limit,MaxBar;
   int counted_bars=IndicatorCounted();
   if(Bars-1 < MA_Period)return(0);
   if (counted_bars<0) return(-1);
   if (counted_bars>0) counted_bars--;
//----
   MaxBar=Bars-1-MA_Period;
   limit =Bars-counted_bars-1;
//----
   if (limit>MaxBar)
     {
      for(int shift=limit;shift>=MaxBar;shift--)
         DrawEMA[Bars-shift]=0.0;
      limit=MaxBar;
     }
   int Tnew=Time[limit+1];
   if (limit<MaxBar)
      if (Tnew==time2)
        {
         EMA1=bEMA1;
         EMA2=bEMA2;
         EMA3=bEMA3;
         EMA4=bEMA4;
         EMA5=bEMA5;
         EMA6=bEMA6;
         EMA7=bEMA7;
         EMA8=bEMA8;
         EMA9=bEMA9;
         EMA10=bEMA10;
        }
      else
        {
         if (Tnew>time2)Print("Error1");
         else Print("Error2");
         return(-1);
        }
   for(shift=limit; shift>=0; shift--)
     {
      if(shift==1)
         if(((limit==1)&&(time2!=Time[2])) || (limit > 1))
           {
            time2=Time[2];
            bEMA1=EMA1;
            bEMA2=EMA2;
            bEMA3=EMA3;
            bEMA4=EMA4;
            bEMA5=EMA5;
            bEMA6=EMA6;
            bEMA7=EMA7;
            bEMA8=EMA8;
            bEMA9=EMA9;
            bEMA10=EMA10;
           }
      EMA1=alfa*iMA(NULL,0,1,0,MODE_SMA,MA_Price,shift) + (1-alfa)*EMA1;
      EMA2=alfa*EMA1 + (1-alfa)*EMA2;
      EMA3=alfa*EMA2 + (1-alfa)*EMA3;
      EMA4=alfa*EMA3 + (1-alfa)*EMA4;
      EMA5=alfa*EMA4 + (1-alfa)*EMA5;
      EMA6=alfa*EMA5 + (1-alfa)*EMA6;
      EMA7=alfa*EMA6 + (1-alfa)*EMA7;
      EMA8=alfa*EMA7 + (1-alfa)*EMA8;
      EMA9=alfa*EMA8 + (1-alfa)*EMA9;
      EMA10= alfa*EMA9 + (1-alfa)*EMA10;
      DrawEMA[shift]=10*EMA1-45*EMA2+120*EMA3-210*EMA4+252*EMA5-210*EMA6+120*EMA7-45*EMA8+10*EMA9-EMA10;
     }
   return(0);
  }
//+------------------------------------------------------------------+
Comments