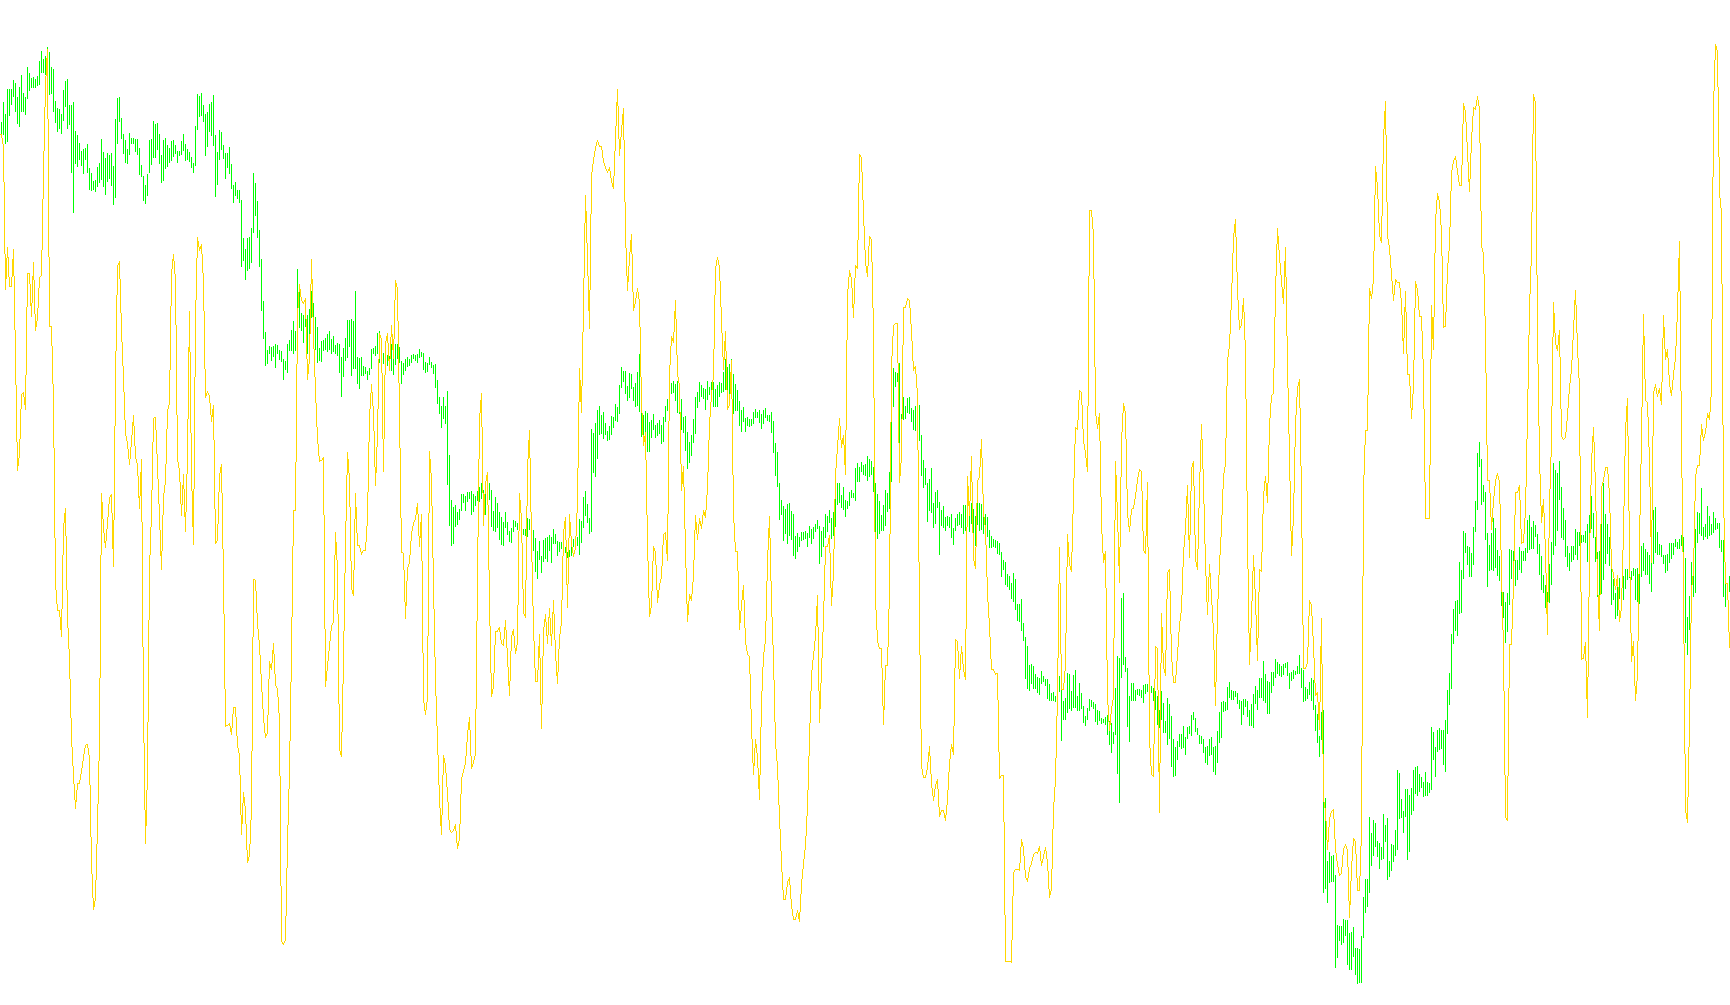
This tool is designed to help traders identify potential trend reversals by measuring the momentum of price movements. Rather than looking at the raw price of an asset, this indicator focuses on the relationship between "upward" and "downward" price changes over a specific period.
How the Logic Works
The script processes market data through three distinct stages to provide a clear, visual representation of market sentiment:
1. Isolating Price Movements The tool first examines the high and low prices of consecutive bars. It separates these into two categories:
- It identifies how much the "highs" are increasing from one bar to the next.
- It identifies how much the "lows" are decreasing from one bar to the next. If a price movement does not result in an increase (for highs) or a decrease (for lows), the script treats that specific movement as zero.
2. Smoothing the Data To prevent the indicator from reacting too wildly to minor, momentary fluctuations, the script applies a moving average to both sets of data (the upward movements and the downward movements). This "smooths out" the noise, ensuring that the resulting information reflects a consistent trend rather than random market jitter.
3. Calculating the Momentum Ratio The final value displayed on your chart is a ratio. The script takes the smoothed upward momentum and divides it by the total combined momentum (upward + downward).
What This Means for the Trader
Because the result is a ratio, the indicator operates within a specific range (0 to 1):
- Approaching 1.0: This suggests that upward price movements are significantly dominating the market. If the line reaches this upper boundary, it may indicate that the buying momentum is becoming exhausted.
- Approaching 0.0: This suggests that downward price movements are dominating. If the line drops toward this lower boundary, it may indicate that selling pressure is reaching a peak.
- The Middle Ground: The indicator helps traders visualize whether the current trend is accelerating or slowing down. By observing where the line sits relative to these boundaries, you can better identify potential areas where a trend might be losing steam and preparing for a reversal.
//+------------------------------------------------------------------+
//|                                                     DeMarker.mq4 |
//|                      Copyright © 2005, MetaQuotes Software Corp. |
//|                                        http://www.metaquotes.net |
//+------------------------------------------------------------------+
#property copyright "Copyright © 2005, MetaQuotes Software Corp."
#property link      "http://www.metaquotes.net"

#property indicator_separate_window
#property indicator_minimum 0
#property indicator_maximum 1
#property indicator_buffers 1
#property indicator_color1 DodgerBlue
#property indicator_level1 0.3
#property indicator_level2 0.7
//---- input parameters
extern int DeMarkerPeriod=14;
//---- buffers
double DeMarkerBuffer[];
double ExtMaxBuffer[];
double ExtMinBuffer[];
//+------------------------------------------------------------------+
//| Custom indicator initialization function                         |
//+------------------------------------------------------------------+
int init()
  {
   string short_name;
//---- 2 additional buffers are used for counting.
   IndicatorBuffers(3);
   SetIndexBuffer(0,DeMarkerBuffer);
   SetIndexBuffer(1,ExtMaxBuffer);
   SetIndexBuffer(2,ExtMinBuffer);
//---- indicator line
   SetIndexStyle(0,DRAW_LINE);
//---- name for DataWindow and indicator subwindow label
   short_name="DeM("+DeMarkerPeriod+")";
   IndicatorShortName(short_name);
   SetIndexLabel(0,short_name);
//---- first values aren't drawn
   SetIndexDrawBegin(0,DeMarkerPeriod);
//----
   return(0);
  }
//+------------------------------------------------------------------+
//| DeMarker                                                         |
//+------------------------------------------------------------------+
int start()
  {
   double dNum;
   int    i,nCountedBars;
//---- insufficient data
   if(Bars<=DeMarkerPeriod) return(0);
//---- bars count that does not changed after last indicator launch.
   nCountedBars=IndicatorCounted();
//----
   ExtMaxBuffer[Bars-1]=0.0;
   ExtMinBuffer[Bars-1]=0.0;
   if(nCountedBars>2) i=Bars-nCountedBars-1;
   else               i=Bars-2;
   while(i>=0)
     {
      dNum=High[i]-High[i+1];
      if(dNum<0.0) dNum=0.0;
      ExtMaxBuffer[i]=dNum;

      dNum=Low[i+1]-Low[i];
      if(dNum<0.0) dNum=0.0;
      ExtMinBuffer[i]=dNum;

      i--;
     }
//---- initial zero
   if(nCountedBars<1)
      for(i=1; i<=DeMarkerPeriod; i++)
         DeMarkerBuffer[Bars-i]=0.0;
//----
   i=Bars-DeMarkerPeriod-1;
   if(nCountedBars>=DeMarkerPeriod) i=Bars-nCountedBars-1;
   while(i>=0)
     {
      dNum=iMAOnArray(ExtMaxBuffer,0,DeMarkerPeriod,0,MODE_SMA,i)+
           iMAOnArray(ExtMinBuffer,0,DeMarkerPeriod,0,MODE_SMA,i);
      if(dNum!=0.0)
         DeMarkerBuffer[i]=iMAOnArray(ExtMaxBuffer,0,DeMarkerPeriod,0,MODE_SMA,i)/dNum;
      else
         DeMarkerBuffer[i]=0.0;

      i--;
     }
   return(0);
  }
//+------------------------------------------------------------------+
Comments