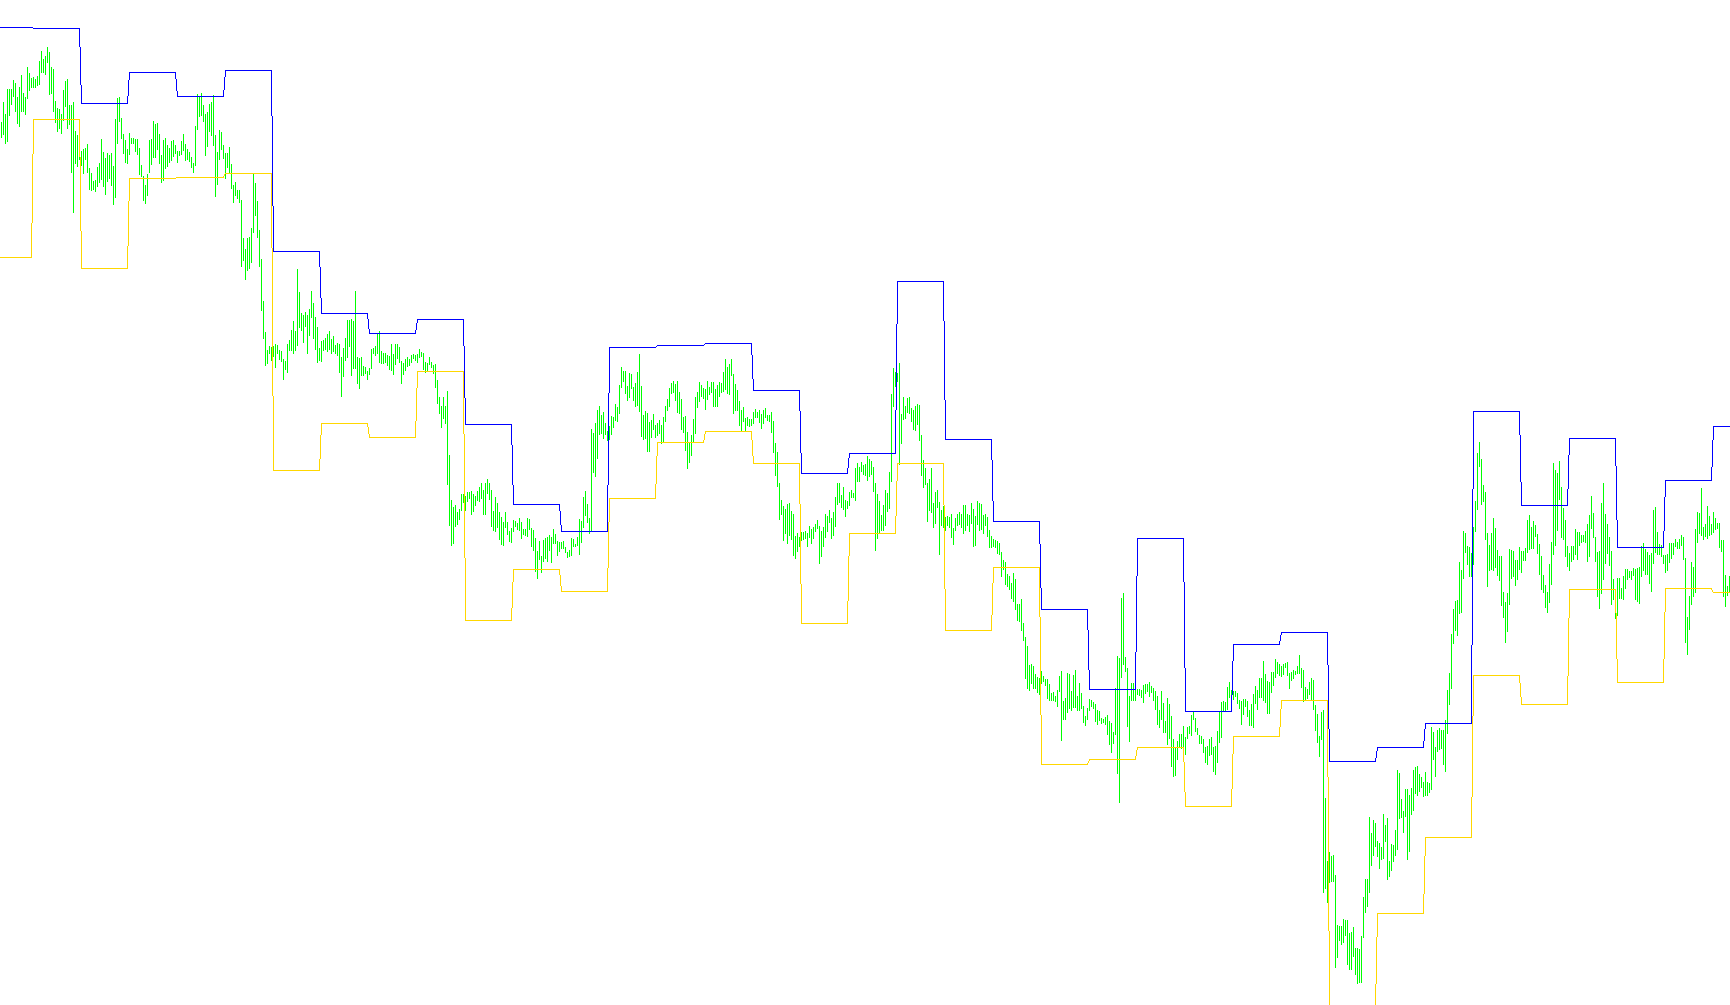
This tool is designed to provide traders with visual price levels based on the preceding day's market activity. It identifies specific mathematical pivot points that transition from one trading day to the next, helping to visualize potential support and resistance areas on the current chart.
How the Logic Works
The script operates by scanning the historical price data to identify the exact moment a new calendar day begins. Once it detects a change in the date, it looks back at the completed daily candle to gather four key pieces of information: the highest price reached (High), the lowest price reached (Low), the opening price, and the closing price.
Calculating the Pivot Points
The core logic determines a specific "target" value based on how the previous day's candle behaved. The calculation changes depending on whether the day ended with a positive, negative, or neutral move:
- Bullish Days: If the previous day closed higher than it opened, the script calculates a weighted average using the high, low, and closing prices.
- Bearish Days: If the previous day closed lower than it opened, the script adjusts the weighting to prioritize the lower price extremes.
- Neutral Days: If the previous day opened and closed at the same price, it uses a balanced calculation involving all three major price points of the day.
Visual Representation
Once these values are calculated, the tool plots two distinct lines on your chart:
- The Upper Boundary: This represents the distance between the calculated pivot point and the previous day's high.
- The Lower Boundary: This represents the distance between the calculated pivot point and the previous day's low.
By plotting these two values, the script creates a dynamic range that helps traders visualize the "Next Day" price zones. Instead of just looking at raw highs and lows, this method provides a customized zone based on the momentum and price action of the completed trading session.
//+------------------------------------------------------------------+
//|                                                DemarkNextDay.mq4 |
//|                      Copyright © 2006, MetaQuotes Software Corp. |
//|                                        http://www.metaquotes.net |
//+------------------------------------------------------------------+
#property indicator_chart_window
#property indicator_buffers 2
#property indicator_color1 Blue
#property indicator_color2 Red


//---- input parameters

//---- buffers

double ExtMapBuffer1[];
double ExtMapBuffer2[];
 double H,L,C,X,O,LastHigh,LastLow;
//+------------------------------------------------------------------+
//| Custom indicator initialization function                         |
//+------------------------------------------------------------------+
int init()
  {
//---- indicators

   SetIndexStyle(0,DRAW_LINE);
   SetIndexBuffer(0,ExtMapBuffer1);
   SetIndexStyle(1,DRAW_LINE);
   SetIndexBuffer(1,ExtMapBuffer2);

//----
   return(0);
  }
//+------------------------------------------------------------------+
//| Custor indicator deinitialization function                       |
//+------------------------------------------------------------------+
int deinit()
  {
//----

//----
   return(0);
  }
//+------------------------------------------------------------------+
//| Custom indicator iteration function                              |
//+------------------------------------------------------------------+
int start()
  {
   int limit,i,b;
      int    counted_bars=IndicatorCounted();
  //---- check for possible errors
   if(counted_bars<0) return(-1);
  //---- last counted bar will be recounted

//   if(counted_bars>0) counted_bars--;
   limit=(Bars-counted_bars)-1;


for (i=limit; i>=0;i--)
{

//if (High[i+1]>LastHigh) LastHigh=High[i+1];
//if (Low[i+1]<LastLow) LastLow=Low[i+1];

if (TimeDay(Time[i])!=TimeDay(Time[i+1]))
   {  if(counted_bars>0) counted_bars--;
   limit=Bars-counted_bars;
  //---- main loop
b = iBarShift(NULL,PERIOD_D1,Time[i+1]);
H = iHigh (NULL,PERIOD_D1,b);
L = iLow (NULL,PERIOD_D1,b);
C = iClose (NULL,PERIOD_D1,b);
O = iOpen (NULL,PERIOD_D1,b);
if   (C>O)
X= ((2*H)+L+C)/2;
if   (O>C)
X= ((2*L)+H+C)/2;
if   (O==C)
X= ((2*C)+L+H)/2;

}
ExtMapBuffer1[i]=X-H;
ExtMapBuffer2[i]=X-L;

  }
   return(0);
  }
Comments