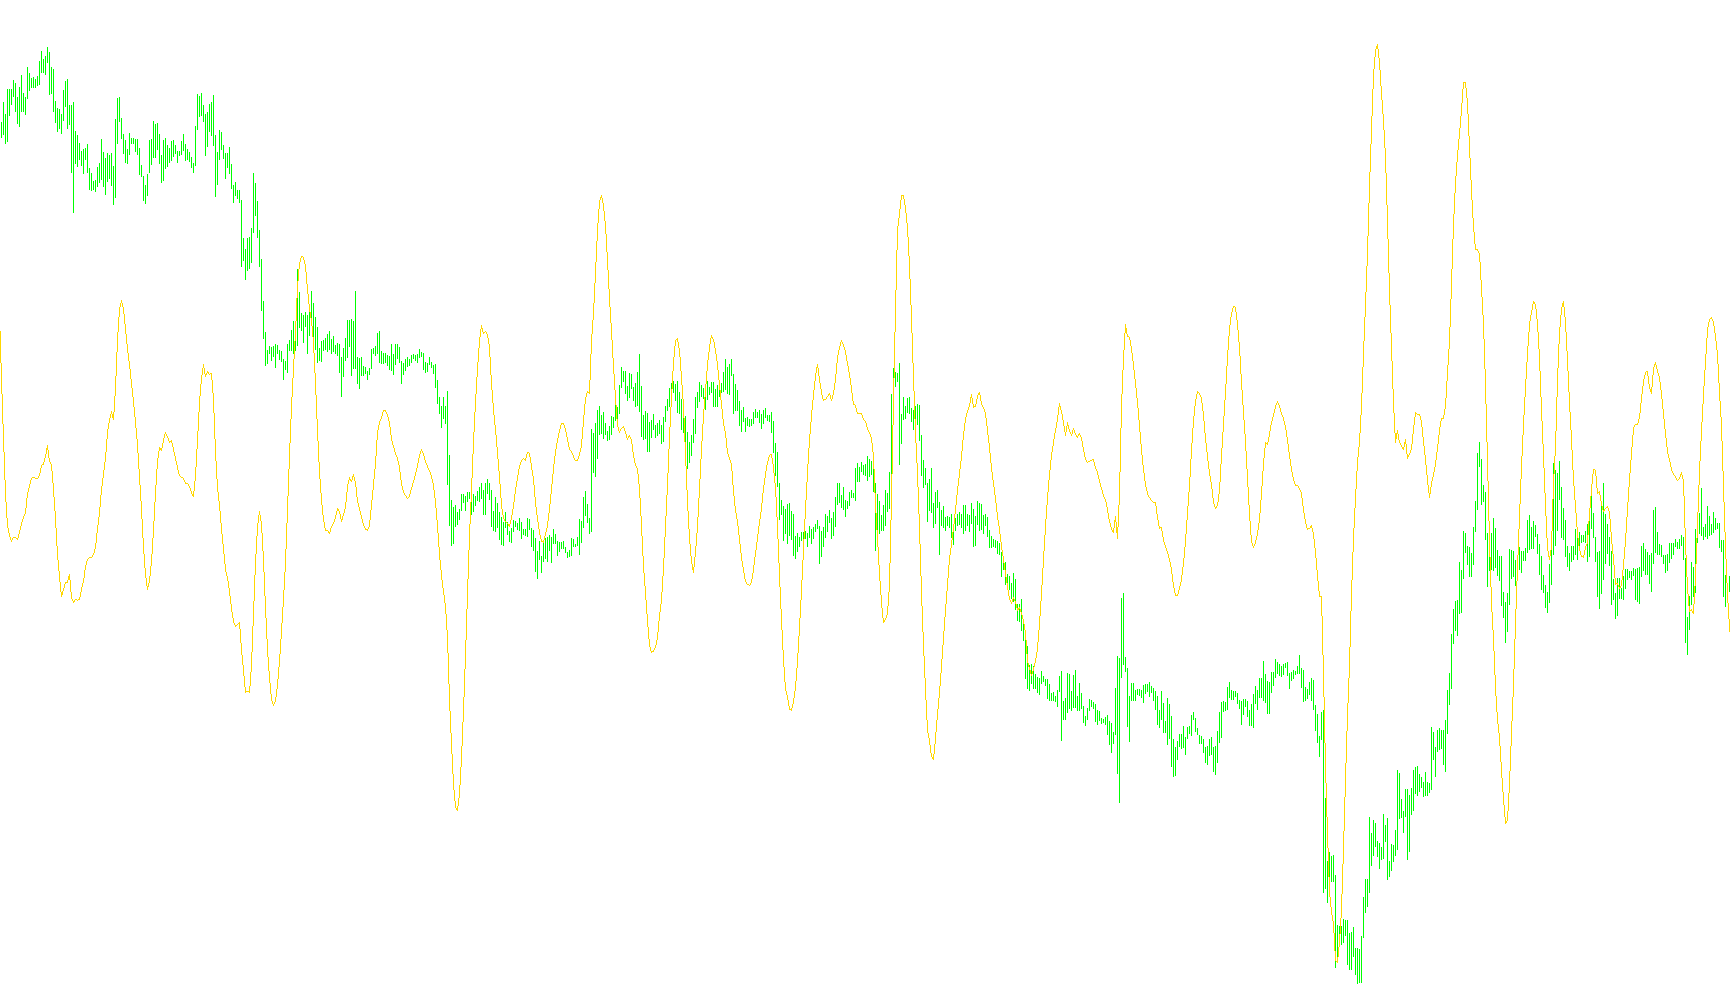
Technical Overview: Digital MACD Logic
The Digital MACD is a specialized technical analysis indicator designed to identify trends and momentum in financial markets. Unlike standard moving averages that treat all past data with equal weight or simple linear decay, this script utilizes a sophisticated "weighted" mathematical approach to analyze price action.
Core Calculation Mechanism
The primary logic of this indicator relies on two distinct weighted calculations performed over a specific window of historical data:
- Primary Data Weighting (Value 1): The script looks back at the recent closing prices and assigns a unique numerical weight to each specific price point. Some past prices are given significant positive importance, while others—representing specific historical "noise" or deviations—are assigned negative weights. This creates a highly customized "fingerprint" of price movement.
- Secondary Data Weighting (Value 2): A second, separate weighted calculation is performed simultaneously. While it also uses a long history of data, the distribution of weights differs from the first calculation. This serves as a balancing mechanism or a secondary perspective on the current trend.
Signal Generation
The indicator produces its visual output through two main components:
- The Main Graph (YellowGreen Line): This is calculated by subtracting the Secondary Weighting from the Primary Weighting. By finding the difference between these two complex mathematical models, the indicator highlights the "net" momentum of the market. When this value rises, it suggests bullish strength; when it falls, it indicates bearish pressure.
- The Signal Line (White Line): To smooth out potential volatility and provide a clearer picture for the trader, the script takes the resulting Main Graph and runs it through a secondary smoothing process. It calculates a simple average over a user-defined period (defaulting to 5), creating a stable baseline that helps identify trend reversals and crossovers.
Summary of Operation
Instead of reacting simply to what the price is doing now, this logic weighs the current price against a specific historical context defined by complex coefficients. By comparing two different weighted "views" of history and then smoothing the result, the indicator aims to filter out market noise and provide a clearer visual representation of underlying market momentum.
//+------------------------------------------------------------------+
//|                                                 Digital MACD.mq4 |
//|                             Digital MACD rewritten by CrazyChart |
//|                                                                  |
//+------------------------------------------------------------------+
#property copyright "Digital MACD rewritten by CrazyChart"
#property link      " "

#property indicator_separate_window
#property indicator_buffers 2
#property indicator_color1 YellowGreen
#property indicator_color2 White
//---- input parameters
extern int       CountBars=300;
extern int       SignalMAPeriod=5;
//---- buffers
double ExtGraph[];
double ExtSignal[];
//+------------------------------------------------------------------+
//| Custom indicator initialization function                         |
//+------------------------------------------------------------------+
int init()
  {
//---- indicators
   SetIndexStyle(0,DRAW_LINE);
   SetIndexBuffer(0,ExtGraph);
   SetIndexStyle(1,DRAW_LINE);
   SetIndexBuffer(1,ExtSignal);
//----
   return(0);
  }
//+------------------------------------------------------------------+
//| Custor indicator deinitialization function                       |
//+------------------------------------------------------------------+
int deinit()
  {
//---- TODO: add your code here

//----
   return(0);
  }
//+------------------------------------------------------------------+
//| Custom indicator iteration function                              |
//+------------------------------------------------------------------+
int start()
  {
   int    counted_bars=IndicatorCounted();
//---- TODO: add your code here
  int shift,cnt,loop,AccountedBars;
  double value1,value2,AVG;
  bool firstTime=true;
if (firstTime) {
   AccountedBars = Bars-CountBars;
   loop = CountBars-SignalMAPeriod-1;
   firstTime=false;
 };

for  (shift=Bars-2;shift>=0;shift--) {
value1 =
 0.2149840610*Close[shift+0]
+0.2065763732*Close[shift+1]
+0.1903728890*Close[shift+2]
+0.1675422436*Close[shift+3]
+0.1397053150*Close[shift+4]
+0.1087951881*Close[shift+5]
+0.0768869405*Close[shift+6]
+0.0460244906*Close[shift+7]
+0.0180517395*Close[shift+8]
-0.0055294579*Close[shift+9]
-0.0236660212*Close[shift+10]
-0.0358140055*Close[shift+11]
-0.0419497760*Close[shift+12]
-0.0425331450*Close[shift+13]
-0.0384279507*Close[shift+14]
-0.0307917433*Close[shift+15]
-0.0209443384*Close[shift+16]
-0.0102335925*Close[shift+17]
+0.0000932767*Close[shift+18]
+0.0089950015*Close[shift+19]
+0.0157131144*Close[shift+20]
+0.0198149331*Close[shift+21]
+0.0211989019*Close[shift+22]
+0.0200639819*Close[shift+23]
+0.0168532934*Close[shift+24]
+0.0121825067*Close[shift+25]
+0.0067474241*Close[shift+26]
+0.0012444305*Close[shift+27]
-0.0037087682*Close[shift+28]
-0.0076300416*Close[shift+29]
-0.0102110543*Close[shift+30]
-0.0113306266*Close[shift+31]
-0.0110462105*Close[shift+32]
-0.0095662166*Close[shift+33]
-0.0072080453*Close[shift+34]
-0.0043494435*Close[shift+35]
-0.0013771970*Close[shift+36]
+0.0013575268*Close[shift+37]
+0.0035760416*Close[shift+38]
+0.0050946166*Close[shift+39]
+0.0058339574*Close[shift+40]
+0.0058160431*Close[shift+41]
+0.0051486631*Close[shift+42]
+0.0039984014*Close[shift+43]
+0.0025619380*Close[shift+44]
+0.0010531475*Close[shift+45]
-0.0003481453*Close[shift+46]
-0.0014937154*Close[shift+47]
-0.0022905986*Close[shift+48]
-0.0027000514*Close[shift+49]
-0.0027359080*Close[shift+50]
-0.0024543322*Close[shift+51]
-0.0019409837*Close[shift+52]
-0.0012957482*Close[shift+53]
-0.0006179734*Close[shift+54]
+0.0000057542*Close[shift+55]
+0.0005111297*Close[shift+56]
+0.0008605279*Close[shift+57]
+0.0010441921*Close[shift+58]
+0.0010775684*Close[shift+59]
+0.0009966494*Close[shift+60]
+0.0008537300*Close[shift+61]
+0.0007142855*Close[shift+62]
+0.0006599146*Close[shift+63]
-0.0008151017*Close[shift+64];

value2 =
 0.0825641231*Close[shift+0]
+0.0822783080*Close[shift+1]
+0.0814249974*Close[shift+2]
+0.0800166909*Close[shift+3]
+0.0780735197*Close[shift+4]
+0.0756232268*Close[shift+5]
+0.0727009740*Close[shift+6]
+0.0693478349*Close[shift+7]
+0.0656105823*Close[shift+8]
+0.0615409157*Close[shift+9]
+0.0571939540*Close[shift+10]
+0.0526285643*Close[shift+11]
+0.0479025123*Close[shift+12]
+0.0430785482*Close[shift+13]
+0.0382152880*Close[shift+14]
+0.0333706133*Close[shift+15]
+0.0286021160*Close[shift+16]
+0.0239614376*Close[shift+17]
+0.0194972056*Close[shift+18]
+0.0152532583*Close[shift+19]
+0.0112682658*Close[shift+20]
+0.0075745482*Close[shift+21]
+0.0041980052*Close[shift+22]
+0.0011588603*Close[shift+23]
-0.0015292889*Close[shift+24]
-0.0038593393*Close[shift+25]
-0.0058303888*Close[shift+26]
-0.0074473108*Close[shift+27]
-0.0087203043*Close[shift+28]
-0.0096645874*Close[shift+29]
-0.0102995666*Close[shift+30]
-0.0106483424*Close[shift+31]
-0.0107374524*Close[shift+32]
-0.0105952115*Close[shift+33]
-0.0102516944*Close[shift+34]
-0.0097377645*Close[shift+35]
-0.0090838346*Close[shift+36]
-0.0083237046*Close[shift+37]
-0.0074804382*Close[shift+38]
-0.0065902734*Close[shift+39]
-0.0056742995*Close[shift+40]
-0.0047554314*Close[shift+41]
-0.0038574209*Close[shift+42]
-0.0029983549*Close[shift+43]
-0.0021924972*Close[shift+44]
-0.0014513858*Close[shift+45]
-0.0007848072*Close[shift+46]
-0.0001995891*Close[shift+47]
+0.0003009728*Close[shift+48]
+0.0007162164*Close[shift+49]
+0.0010478905*Close[shift+50]
+0.0012994016*Close[shift+51]
+0.0014755433*Close[shift+52]
+0.0015824007*Close[shift+53]
+0.0016272598*Close[shift+54]
+0.0016185271*Close[shift+55]
+0.0015648336*Close[shift+56]
+0.0014747659*Close[shift+57]
+0.0013569946*Close[shift+58]
+0.0012193896*Close[shift+59]
+0.0010695971*Close[shift+60]
+0.0009140878*Close[shift+61]
+0.0007591540*Close[shift+62]
+0.0016019033*Close[shift+63];

ExtGraph[shift]=value1-value2;
   if (shift>0) AccountedBars=AccountedBars+1;
};

for (shift=loop;shift>=0;shift--) {
	AVG = 0;
   for (cnt=0;cnt<=SignalMAPeriod-1;cnt++) {
	  AVG = AVG + ExtGraph[shift+cnt];
   };
   ExtSignal[shift]=AVG/SignalMAPeriod;
   if (shift>0) loop = loop-1;
};


//----
   return(0);
  }
//+------------------------------------------------------------------+
Comments