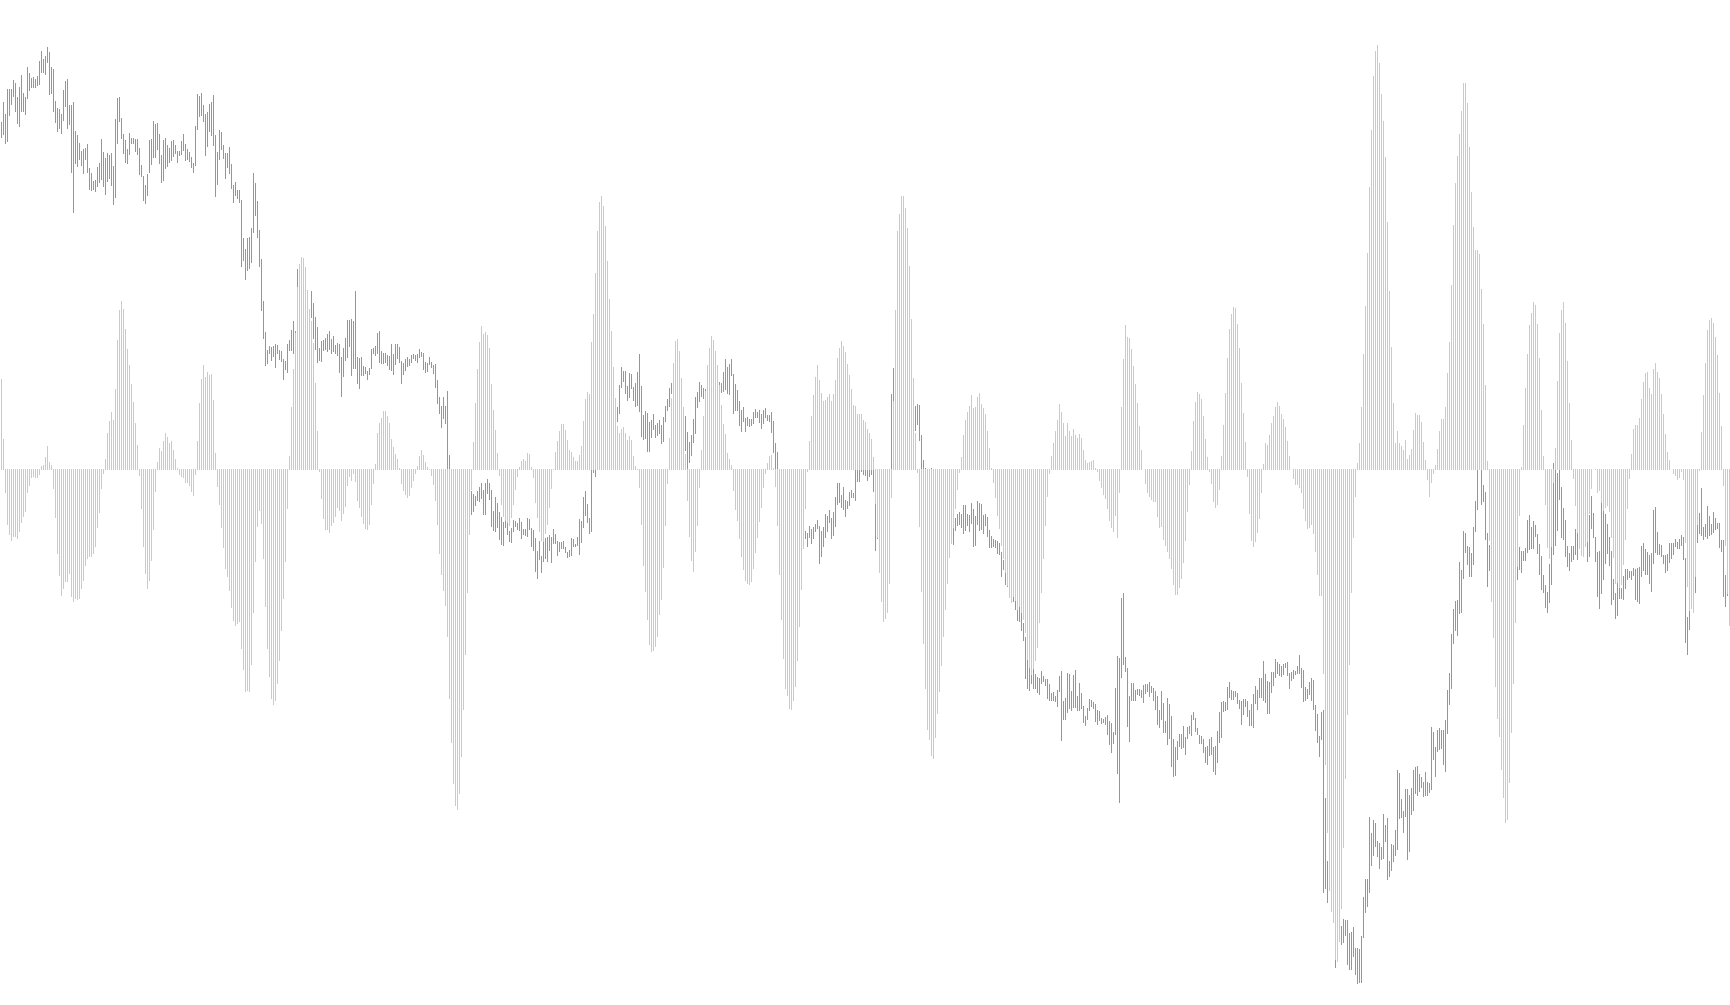
This script is a technical analysis tool designed for the MetaTrader platform. It functions as a "Digital MACD," which is a customized version of the Moving Average Convergence Divergence indicator. Its primary purpose is to help traders visualize price momentum and potential trend reversals by calculating the difference between two distinct mathematical models of price movement.
Core Logic Overview
The script operates by processing historical price data (specifically closing prices) through two different weighted calculations. Here is a breakdown of how it arrives at its final visual output:
1. The Dual Calculation System
Instead of using standard moving averages, the script employs two complex, pre-defined mathematical formulas (referred to in the code as value1 and value2).
- Each formula assigns a specific "weight" or multiplier to the closing prices of the last 64 candles.
- Some prices are weighted positively, while others are weighted negatively.
- This weighting creates two different "views" of the current market trend.
2. Generating the Main Signal (The Histogram)
The script subtracts the second calculated value from the first (value1 - value2). The resulting difference is plotted as a Histogram.
- When the histogram bars are above zero, it generally suggests one momentum is overpowering the other.
- When the bars cross below zero, it suggests a shift in that momentum.
3. The Smoothing Signal (The Line) To make the data easier for a human to read and to filter out "noise" (minor, insignificant price flickers), the script takes the Histogram results and applies an additional smoothing layer:
- It looks at a specific window of time (defined by the
SignalMAPeriod). - It calculates the average value of the histogram over that period.
- This average is plotted as a Line.
How to Interpret the Result
By looking at the relationship between the Histogram and the Line, traders look for:
- Trend Strength: How high or low the histogram bars rise relative to the line.
- Momentum Shifts: When the histogram starts to turn back toward the signal line, it may indicate that the current move is losing steam.
- Crossovers: When the histogram moves from one side of the signal line to the other, it often serves as a visual cue for potential price changes.
Summary of Settings
- CountBars: Determines how much historical data the script analyzes to build its calculation.
- SignalMAPeriod: Controls how "smooth" the signal line appears; a higher number results in a smoother line that reacts more slowly, while a lower number makes it react faster to price changes.
//+------------------------------------------------------------------+
//|                                                 Digital MACD.mq4 |
//|                             Digital MACD rewritten by CrazyChart |
//|                                                                  |
//+------------------------------------------------------------------+
#property copyright "Digital MACD rewritten by CrazyChart"
#property link      " "

#property indicator_separate_window
#property indicator_buffers 2
#property indicator_color1 YellowGreen
#property indicator_color2 White
//---- input parameters
extern int       CountBars=300;
extern int       SignalMAPeriod=5;
//---- buffers
double ExtGraph[];
double ExtSignal[];
//+------------------------------------------------------------------+
//| Custom indicator initialization function                         |
//+------------------------------------------------------------------+
int init()
  {
//---- indicators
   SetIndexStyle(0,DRAW_HISTOGRAM);
   SetIndexBuffer(0,ExtGraph);
   SetIndexStyle(1,DRAW_LINE);
   SetIndexBuffer(1,ExtSignal);
//----
   return(0);
  }
//+------------------------------------------------------------------+
//| Custor indicator deinitialization function                       |
//+------------------------------------------------------------------+
int deinit()
  {
//---- TODO: add your code here

//----
   return(0);
  }
//+------------------------------------------------------------------+
//| Custom indicator iteration function                              |
//+------------------------------------------------------------------+
int start()
  {
   int    counted_bars=IndicatorCounted();
//---- TODO: add your code here
  int shift,cnt,loop,AccountedBars;
  double value1,value2,AVG;
  bool firstTime=true;
if (firstTime) {
   AccountedBars = Bars-CountBars;
   loop = CountBars-SignalMAPeriod-1;
   firstTime=false;
 }

for  (shift=Bars-2;shift>=0;shift--) {
value1 =
 0.2149840610*Close[shift+0]
+0.2065763732*Close[shift+1]
+0.1903728890*Close[shift+2]
+0.1675422436*Close[shift+3]
+0.1397053150*Close[shift+4]
+0.1087951881*Close[shift+5]
+0.0768869405*Close[shift+6]
+0.0460244906*Close[shift+7]
+0.0180517395*Close[shift+8]
-0.0055294579*Close[shift+9]
-0.0236660212*Close[shift+10]
-0.0358140055*Close[shift+11]
-0.0419497760*Close[shift+12]
-0.0425331450*Close[shift+13]
-0.0384279507*Close[shift+14]
-0.0307917433*Close[shift+15]
-0.0209443384*Close[shift+16]
-0.0102335925*Close[shift+17]
+0.0000932767*Close[shift+18]
+0.0089950015*Close[shift+19]
+0.0157131144*Close[shift+20]
+0.0198149331*Close[shift+21]
+0.0211989019*Close[shift+22]
+0.0200639819*Close[shift+23]
+0.0168532934*Close[shift+24]
+0.0121825067*Close[shift+25]
+0.0067474241*Close[shift+26]
+0.0012444305*Close[shift+27]
-0.0037087682*Close[shift+28]
-0.0076300416*Close[shift+29]
-0.0102110543*Close[shift+30]
-0.0113306266*Close[shift+31]
-0.0110462105*Close[shift+32]
-0.0095662166*Close[shift+33]
-0.0072080453*Close[shift+34]
-0.0043494435*Close[shift+35]
-0.0013771970*Close[shift+36]
+0.0013575268*Close[shift+37]
+0.0035760416*Close[shift+38]
+0.0050946166*Close[shift+39]
+0.0058339574*Close[shift+40]
+0.0058160431*Close[shift+41]
+0.0051486631*Close[shift+42]
+0.0039984014*Close[shift+43]
+0.0025619380*Close[shift+44]
+0.0010531475*Close[shift+45]
-0.0003481453*Close[shift+46]
-0.0014937154*Close[shift+47]
-0.0022905986*Close[shift+48]
-0.0027000514*Close[shift+49]
-0.0027359080*Close[shift+50]
-0.0024543322*Close[shift+51]
-0.0019409837*Close[shift+52]
-0.0012957482*Close[shift+53]
-0.0006179734*Close[shift+54]
+0.0000057542*Close[shift+55]
+0.0005111297*Close[shift+56]
+0.0008605279*Close[shift+57]
+0.0010441921*Close[shift+58]
+0.0010775684*Close[shift+59]
+0.0009966494*Close[shift+60]
+0.0008537300*Close[shift+61]
+0.0007142855*Close[shift+62]
+0.0006599146*Close[shift+63]
-0.0008151017*Close[shift+64];

value2 =
 0.0825641231*Close[shift+0]
+0.0822783080*Close[shift+1]
+0.0814249974*Close[shift+2]
+0.0800166909*Close[shift+3]
+0.0780735197*Close[shift+4]
+0.0756232268*Close[shift+5]
+0.0727009740*Close[shift+6]
+0.0693478349*Close[shift+7]
+0.0656105823*Close[shift+8]
+0.0615409157*Close[shift+9]
+0.0571939540*Close[shift+10]
+0.0526285643*Close[shift+11]
+0.0479025123*Close[shift+12]
+0.0430785482*Close[shift+13]
+0.0382152880*Close[shift+14]
+0.0333706133*Close[shift+15]
+0.0286021160*Close[shift+16]
+0.0239614376*Close[shift+17]
+0.0194972056*Close[shift+18]
+0.0152532583*Close[shift+19]
+0.0112682658*Close[shift+20]
+0.0075745482*Close[shift+21]
+0.0041980052*Close[shift+22]
+0.0011588603*Close[shift+23]
-0.0015292889*Close[shift+24]
-0.0038593393*Close[shift+25]
-0.0058303888*Close[shift+26]
-0.0074473108*Close[shift+27]
-0.0087203043*Close[shift+28]
-0.0096645874*Close[shift+29]
-0.0102995666*Close[shift+30]
-0.0106483424*Close[shift+31]
-0.0107374524*Close[shift+32]
-0.0105952115*Close[shift+33]
-0.0102516944*Close[shift+34]
-0.0097377645*Close[shift+35]
-0.0090838346*Close[shift+36]
-0.0083237046*Close[shift+37]
-0.0074804382*Close[shift+38]
-0.0065902734*Close[shift+39]
-0.0056742995*Close[shift+40]
-0.0047554314*Close[shift+41]
-0.0038574209*Close[shift+42]
-0.0029983549*Close[shift+43]
-0.0021924972*Close[shift+44]
-0.0014513858*Close[shift+45]
-0.0007848072*Close[shift+46]
-0.0001995891*Close[shift+47]
+0.0003009728*Close[shift+48]
+0.0007162164*Close[shift+49]
+0.0010478905*Close[shift+50]
+0.0012994016*Close[shift+51]
+0.0014755433*Close[shift+52]
+0.0015824007*Close[shift+53]
+0.0016272598*Close[shift+54]
+0.0016185271*Close[shift+55]
+0.0015648336*Close[shift+56]
+0.0014747659*Close[shift+57]
+0.0013569946*Close[shift+58]
+0.0012193896*Close[shift+59]
+0.0010695971*Close[shift+60]
+0.0009140878*Close[shift+61]
+0.0007591540*Close[shift+62]
+0.0016019033*Close[shift+63];

ExtGraph[shift]=value1-value2;
   if (shift>0) AccountedBars=AccountedBars+1;
}

for (shift=loop;shift>=0;shift--) {
	AVG = 0;
   for (cnt=0;cnt<=SignalMAPeriod-1;cnt++) {
	  AVG = AVG + ExtGraph[shift+cnt];
   }
   ExtSignal[shift]=AVG/SignalMAPeriod;
   if (shift>0) loop = loop-1;
}


//----
   return(0);
  }
//+------------------------------------------------------------------+
Comments