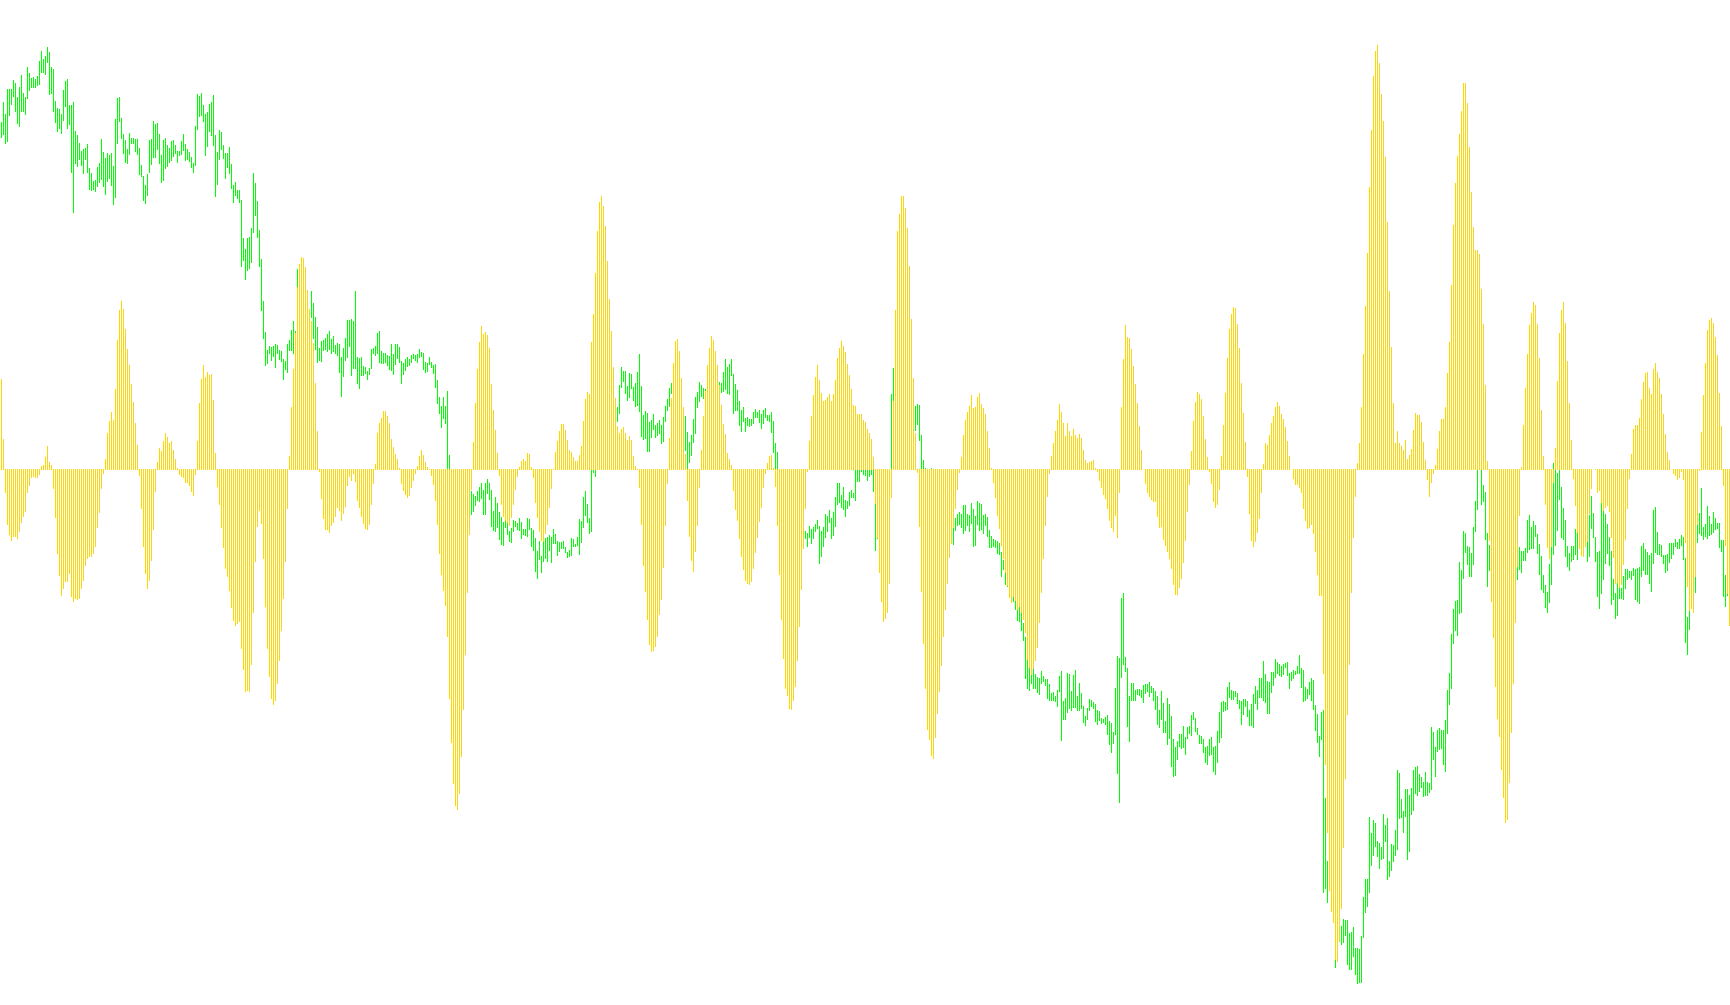
This script functions as a specialized technical analysis tool designed to track price momentum and trend direction. Unlike standard indicators that might rely on simple averages, this "Digital MACD" uses a sophisticated weighted calculation to provide a clearer picture of market movement.
Core Logic Overview
The script operates by processing historical price data through two distinct mathematical layers:
1. The Weighted Momentum Calculation The heart of the script lies in a complex weighting system. Instead of treating every past price point as equally important, the script assigns a specific unique multiplier (a "weight") to 64 different historical price points for both of its primary components.
- Component 1: A weighted sum of recent and past prices.
- Component 2: A second, distinct weighted sum of those same prices using a different set of multipliers.
By subtracting the second component from the first, the script identifies the "gap" or momentum between these two calculations. This results in a primary data stream represented visually as a histogram on your chart.
2. The Signal Smoothing Layer
Once the primary momentum (the histogram) is calculated, the script performs a secondary operation to create a "Signal" line. It takes a specific window of recent histogram values (defined by the SignalMAPeriod setting) and calculates their average.
How to Interpret the Visuals
The tool generates two visual elements on a separate window beneath your main price chart:
- The Histogram: This represents the immediate momentum. When it fluctuates, it shows you how the weighted relationship between past prices is shifting in real-time.
- The Signal Line: This is a smoother version of that momentum. Traders typically look at the relationship between the histogram and this signal line—specifically looking for "crosses" or significant divergences—to identify potential shifts in trend direction or strength.
Summary of Operation
In simple terms, the script looks at the last 64 candles, applies a very precise mathematical "recipe" to those prices to determine momentum, and then smooths that result out into a readable line. This helps filter out minor market noise while highlighting the underlying trend established by historical price action.
//+------------------------------------------------------------------+
//|                                                 Digital MACD.mq4 |
//|                             Digital MACD rewritten by CrazyChart |
//|                                                                  |
//+------------------------------------------------------------------+
#property copyright "Digital MACD rewritten by CrazyChart"
#property link      " "
//----
#property indicator_separate_window
#property indicator_buffers 2
#property indicator_color1 YellowGreen
#property indicator_color2 White
//---- input parameters
extern int       CountBars=300;
extern int       SignalMAPeriod=5;
//---- buffers
double ExtGraph[];
double ExtSignal[];
//+------------------------------------------------------------------+
//| Custom indicator initialization function                         |
//+------------------------------------------------------------------+
int init()
  {
//---- indicators
   SetIndexStyle(0,DRAW_HISTOGRAM);
   SetIndexBuffer(0,ExtGraph);
   SetIndexStyle(1,DRAW_LINE);
   SetIndexBuffer(1,ExtSignal);
//----
   return(0);
  }
//+------------------------------------------------------------------+
//| Custor indicator deinitialization function                       |
//+------------------------------------------------------------------+
int deinit()
  {
//---- TODO: add your code here
//----
   return(0);
  }
//+------------------------------------------------------------------+
//| Custom indicator iteration function                              |
//+------------------------------------------------------------------+
int start()
  {
   int    counted_bars=IndicatorCounted();
//---- TODO: add your code here
   int shift,cnt,loop,AccountedBars;
   double value1,value2,AVG;
   bool firstTime=true;
   if (firstTime)
     {
      AccountedBars=Bars-CountBars;
      loop=CountBars-SignalMAPeriod-1;
      firstTime=false;
     }
   for(shift=Bars-2;shift>=0;shift--)
     {
      value1=
      0.2149840610*Close[shift+0]
      +0.2065763732*Close[shift+1]
      +0.1903728890*Close[shift+2]
      +0.1675422436*Close[shift+3]
      +0.1397053150*Close[shift+4]
      +0.1087951881*Close[shift+5]
      +0.0768869405*Close[shift+6]
      +0.0460244906*Close[shift+7]
      +0.0180517395*Close[shift+8]
      -0.0055294579*Close[shift+9]
      -0.0236660212*Close[shift+10]
      -0.0358140055*Close[shift+11]
      -0.0419497760*Close[shift+12]
      -0.0425331450*Close[shift+13]
      -0.0384279507*Close[shift+14]
      -0.0307917433*Close[shift+15]
      -0.0209443384*Close[shift+16]
      -0.0102335925*Close[shift+17]
      +0.0000932767*Close[shift+18]
      +0.0089950015*Close[shift+19]
      +0.0157131144*Close[shift+20]
      +0.0198149331*Close[shift+21]
      +0.0211989019*Close[shift+22]
      +0.0200639819*Close[shift+23]
      +0.0168532934*Close[shift+24]
      +0.0121825067*Close[shift+25]
      +0.0067474241*Close[shift+26]
      +0.0012444305*Close[shift+27]
      -0.0037087682*Close[shift+28]
      -0.0076300416*Close[shift+29]
      -0.0102110543*Close[shift+30]
      -0.0113306266*Close[shift+31]
      -0.0110462105*Close[shift+32]
      -0.0095662166*Close[shift+33]
      -0.0072080453*Close[shift+34]
      -0.0043494435*Close[shift+35]
      -0.0013771970*Close[shift+36]
      +0.0013575268*Close[shift+37]
      +0.0035760416*Close[shift+38]
      +0.0050946166*Close[shift+39]
      +0.0058339574*Close[shift+40]
      +0.0058160431*Close[shift+41]
      +0.0051486631*Close[shift+42]
      +0.0039984014*Close[shift+43]
      +0.0025619380*Close[shift+44]
      +0.0010531475*Close[shift+45]
      -0.0003481453*Close[shift+46]
      -0.0014937154*Close[shift+47]
      -0.0022905986*Close[shift+48]
      -0.0027000514*Close[shift+49]
      -0.0027359080*Close[shift+50]
      -0.0024543322*Close[shift+51]
      -0.0019409837*Close[shift+52]
      -0.0012957482*Close[shift+53]
      -0.0006179734*Close[shift+54]
      +0.0000057542*Close[shift+55]
      +0.0005111297*Close[shift+56]
      +0.0008605279*Close[shift+57]
      +0.0010441921*Close[shift+58]
      +0.0010775684*Close[shift+59]
      +0.0009966494*Close[shift+60]
      +0.0008537300*Close[shift+61]
      +0.0007142855*Close[shift+62]
      +0.0006599146*Close[shift+63]
      -0.0008151017*Close[shift+64];
      //----
      value2=
      0.0825641231*Close[shift+0]
      +0.0822783080*Close[shift+1]
      +0.0814249974*Close[shift+2]
      +0.0800166909*Close[shift+3]
      +0.0780735197*Close[shift+4]
      +0.0756232268*Close[shift+5]
      +0.0727009740*Close[shift+6]
      +0.0693478349*Close[shift+7]
      +0.0656105823*Close[shift+8]
      +0.0615409157*Close[shift+9]
      +0.0571939540*Close[shift+10]
      +0.0526285643*Close[shift+11]
      +0.0479025123*Close[shift+12]
      +0.0430785482*Close[shift+13]
      +0.0382152880*Close[shift+14]
      +0.0333706133*Close[shift+15]
      +0.0286021160*Close[shift+16]
      +0.0239614376*Close[shift+17]
      +0.0194972056*Close[shift+18]
      +0.0152532583*Close[shift+19]
      +0.0112682658*Close[shift+20]
      +0.0075745482*Close[shift+21]
      +0.0041980052*Close[shift+22]
      +0.0011588603*Close[shift+23]
      -0.0015292889*Close[shift+24]
      -0.0038593393*Close[shift+25]
      -0.0058303888*Close[shift+26]
      -0.0074473108*Close[shift+27]
      -0.0087203043*Close[shift+28]
      -0.0096645874*Close[shift+29]
      -0.0102995666*Close[shift+30]
      -0.0106483424*Close[shift+31]
      -0.0107374524*Close[shift+32]
      -0.0105952115*Close[shift+33]
      -0.0102516944*Close[shift+34]
      -0.0097377645*Close[shift+35]
      -0.0090838346*Close[shift+36]
      -0.0083237046*Close[shift+37]
      -0.0074804382*Close[shift+38]
      -0.0065902734*Close[shift+39]
      -0.0056742995*Close[shift+40]
      -0.0047554314*Close[shift+41]
      -0.0038574209*Close[shift+42]
      -0.0029983549*Close[shift+43]
      -0.0021924972*Close[shift+44]
      -0.0014513858*Close[shift+45]
      -0.0007848072*Close[shift+46]
      -0.0001995891*Close[shift+47]
      +0.0003009728*Close[shift+48]
      +0.0007162164*Close[shift+49]
      +0.0010478905*Close[shift+50]
      +0.0012994016*Close[shift+51]
      +0.0014755433*Close[shift+52]
      +0.0015824007*Close[shift+53]
      +0.0016272598*Close[shift+54]
      +0.0016185271*Close[shift+55]
      +0.0015648336*Close[shift+56]
      +0.0014747659*Close[shift+57]
      +0.0013569946*Close[shift+58]
      +0.0012193896*Close[shift+59]
      +0.0010695971*Close[shift+60]
      +0.0009140878*Close[shift+61]
      +0.0007591540*Close[shift+62]
      +0.0016019033*Close[shift+63];
      ExtGraph[shift]=value1-value2;
      if (shift>0) AccountedBars=AccountedBars+1;
     }
   for(shift=loop;shift>=0;shift--)
     {
      AVG=0;
      for(cnt=0;cnt<=SignalMAPeriod-1;cnt++)
        {
         AVG=AVG + ExtGraph[shift+cnt];
        }
      ExtSignal[shift]=AVG/SignalMAPeriod;
      if (shift>0) loop=loop-1;
     }
//----
   return(0);
  }
//+------------------------------------------------------------------+
Comments