Dinap tar[1]. zig zag
Download script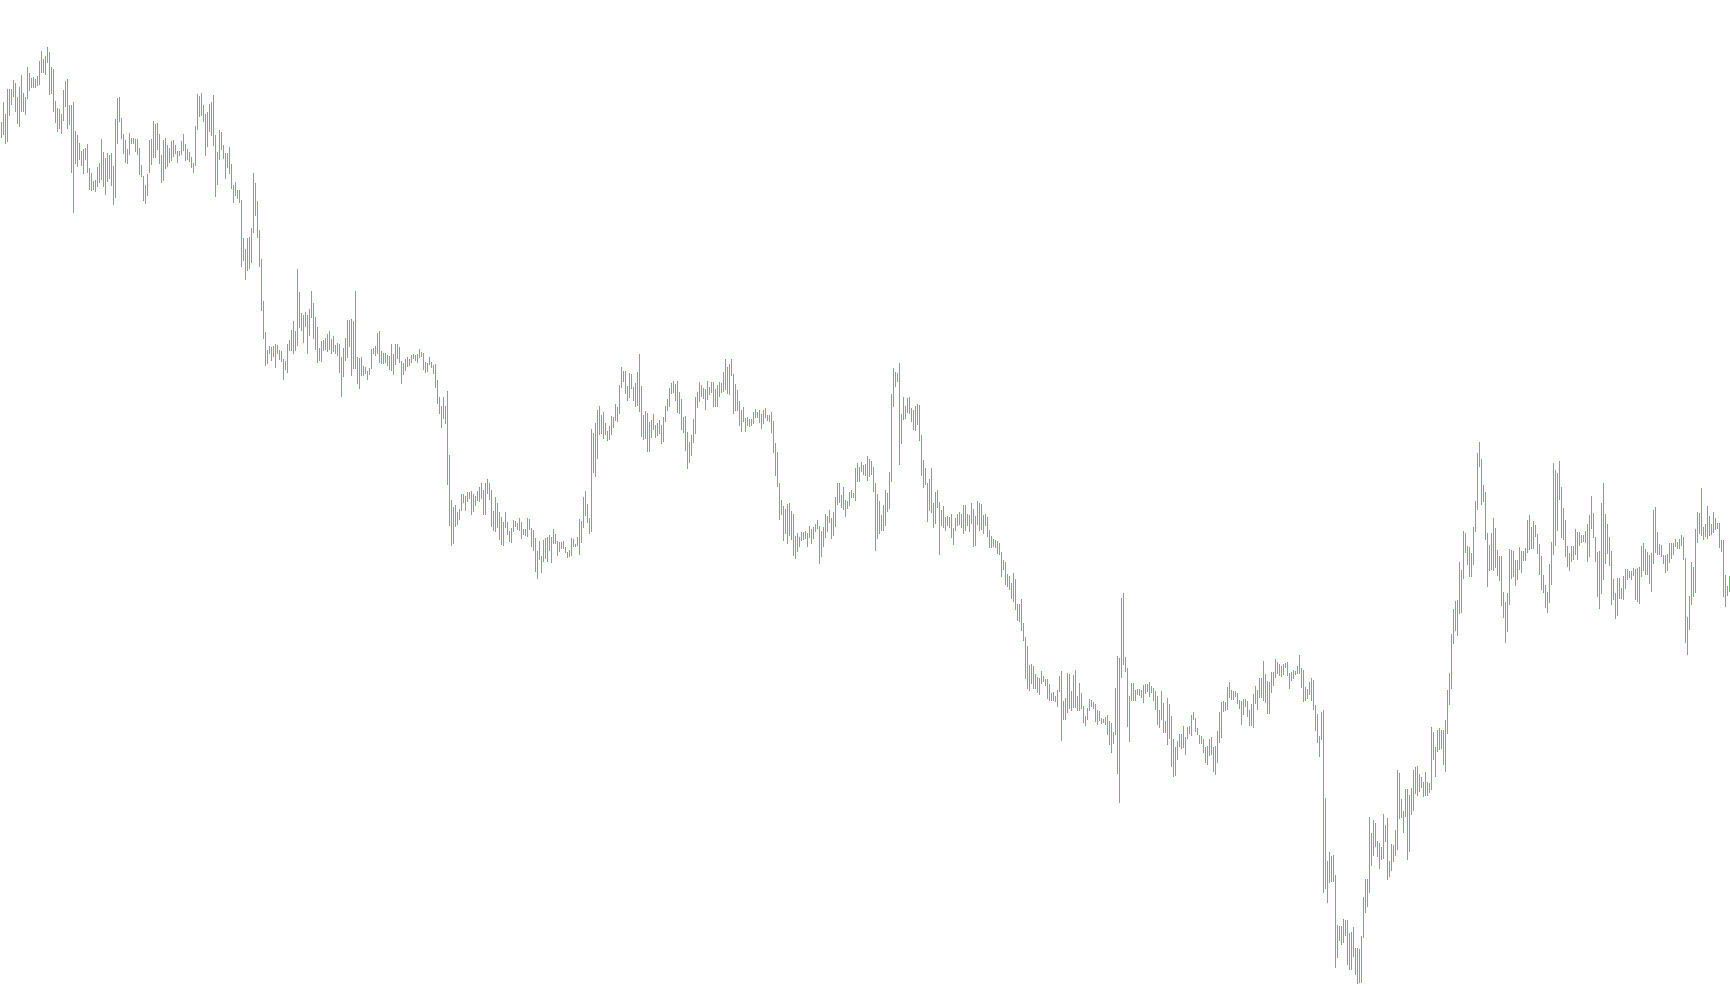
This script is designed as a visual tool for traders to identify significant price movements and structural "swings" in the market. By analyzing historical price data, it automatically detects major peaks and valleys to help users see the primary direction of the trend more clearly.
How the Logic Works
The script operates by scanning through historical price bars to distinguish between minor market noise and meaningful price action. Here is a breakdown of its core logic:
1. Establishing a Reference Zone Rather than looking at every tiny fluctuation, the script uses a predefined "look-back" window (determined by the Length parameter). It examines this specific area to identify what the local highs and lows are, creating a baseline for what constitutes a "significant" move.
2. Identifying Swing Points The tool continuously monitors the price to see if it breaks outside of the established high or low boundaries:
- Highs: If the price climbs above the recent peak, the script flags this as potential upward momentum.
- Lows: If the price drops below the recent valley, the script flags this as potential downward momentum.
- Trend Reversals: When the script detects a shift (for example, moving from an upward move to a downward move), it marks these specific points as "Swing" coordinates.
3. Filtering Market Noise One of the primary functions of this logic is its ability to ignore small fluctuations. It only registers a new point when the price moves convincingly enough to be considered a structural change. By doing this, it filters out the "jitter" of the market, leaving behind a cleaner path of high and low points.
4. Visual Mapping Once the script identifies these key peak and valley coordinates, it maps them onto your chart as a connected line (the ZigZag). This creates a visual "pathway" that connects significant highs to significant lows, allowing you to see the underlying structure of the market movements at a glance.
Summary for the User
Think of this script as an automated way to draw the "skeleton" of the market. It ignores the small movements and only highlights the major turns in price. This makes it easier to identify support and resistance levels, understand the current trend strength, and see where the price has historically reversed direction.
//+------------------------------------------------------------------+
//|                                         Dinapoli ZZ (ZigZag).mq4 |
//|                                          rewritten by CrazyChart |
//|                                                                  |
//+------------------------------------------------------------------+
#property copyright "rewritten by CrazyChart"
#property link      ""

#property indicator_chart_window
#property indicator_buffers 1
#property indicator_color1 Blue
//---- input parameters
extern int       barn=300;
extern int       Length=6;
//---- buffers
double ExtMapBuffer1[];
//double ExtMapBuffer2[];
//+------------------------------------------------------------------+
//| Custom indicator initialization function                         |
//+------------------------------------------------------------------+
int init()
  {
//---- indicators
   SetIndexEmptyValue(0,0.0);
  //SetIndexDrawBegin(0, barn);
   SetIndexStyle(0,DRAW_SECTION);
   SetIndexBuffer(0,ExtMapBuffer1);

//----
   return(0);
  }
//+------------------------------------------------------------------+
//| Custor indicator deinitialization function                       |
//+------------------------------------------------------------------+
int deinit()
  {

   return(0);
  }
//+------------------------------------------------------------------+
//| Custom indicator iteration function                              |
//+------------------------------------------------------------------+
int start()
  {
   int    counted_bars=IndicatorCounted();
   int shift,Swing,Swing_n,uzl,i,zu,zd,mv;
   double LL,HH,BH,BL,NH,NL;
   double Uzel[10000][3];
   string text;
// loop from first bar to current bar (with shift=0)
      Swing_n=0;Swing=0;uzl=0;
      BH =High[barn];BL=Low[barn];zu=barn;zd=barn;

for (shift=barn;shift>=0;shift--) {
      LL=10000000;HH=-100000000;
   for (i=shift+Length;i>=shift+1;i--) {
         if (Low[i]< LL) {LL=Low[i];}
         if (High[i]>HH) {HH=High[i];}
   }


   if (Low[shift]<LL && High[shift]>HH){
      Swing=2;
      if (Swing_n==1) {zu=shift+1;}
      if (Swing_n==-1) {zd=shift+1;}
   } else {
      if (Low[shift]<LL) {Swing=-1;}
      if (High[shift]>HH) {Swing=1;}
   }

   if (Swing!=Swing_n && Swing_n!=0) {
   if (Swing==2) {
      Swing=-Swing_n;BH = High[shift];BL = Low[shift];
   }
      uzl=uzl+1;
   if (Swing==1) {
      Uzel[uzl][1]=zd;
      Uzel[uzl][2]=BL;
   }
   if (Swing==-1) {
      Uzel[uzl][1]=zu;
      Uzel[uzl][2]=BH;
   }
      BH = High[shift];
      BL = Low[shift];
   }

   if (Swing==1) {
      if (High[shift]>=BH) {BH=High[shift];zu=shift;}}
      if (Swing==-1) {
          if (Low[shift]<=BL) {BL=Low[shift]; zd=shift;}}
      Swing_n=Swing;
   }
   for (i=1;i<=uzl;i++) {
      //text=DoubleToStr(Uzel[i][1],0);
      //text=;
         mv=StrToInteger(DoubleToStr(Uzel[i][1],0));
      ExtMapBuffer1[mv]=Uzel[i][2];
   }


   return(0);
  }
//+------------------------------------------------------------------+
Comments